
Memory End-to-End Call Chain Tracing (Memory Traces)
Feature overview and core scenarios
Memory End-to-End Call Chain Tracing (Memory Traces) is a full-chain performance profiling and fault diagnosis capability deeply integrated between Agentbase Memory (v2.10.0) and the agent operations observability center (AgentOps / Observability). In enterprise-grade agent production environments—for example, in the flagship project 企业智能客服与知识中台 (Project ID: enterprise-ai-hub-210, based on OceanBase Shared V2 storage mode) under Agentbase 企业智能中台 (Organization ID: 69c6d1aa00062e6bb60)—a seemingly simple memory read or write often spans multiple heterogeneous computing stages:
Synchronous online search and retrieval (
search/recall): Involves optional user profile query rewriting (qwen-plus), 1024-dimensional dense vector encoding (text-embedding-v3), DashScope sparse term weight encoding, OceanBase multi-path index concurrent queries (Dense + Sparse + Keyword + Graph), RRF fusion ranking, semantic reranking (qwen3.7-text-rerank), and progressive hierarchical trimming (L3 -> L2 -> L1 -> L0, protected by450msdeadlineMs);Asynchronous intelligent writing and higher-order evolution (
infer=truewrite / multimodal parsing / profile extraction / Dreaming aggregation / experience and skill distillation): Involves API gateway acceptance (HTTP202), background queue queuing (queueDurationMs), multimodal visual parsing (qwen-vl-max), fact and knowledge extraction Generation, similar candidate vector retrieval, conflict determination (ADD/UPDATE/DELETE/NONE), and multi-dimensional projection persistence.
When R&D or SRE operations personnel need to locate the following core production issues:
Retrieval latency breakdown: "Why did a certain
hybridhybrid retrieval take 420ms in total? Was the time spent on the OceanBase vector index scan, or on theqwen3.7-text-rerankreranking network round trips of upstreamdashscope-prod?"Async extraction and deduplication attribution: "Why were no new memories added after the VIP architect
user_zhangwei_001submitted multi-turn conversationsinfer=true? Did the model decideNONE(duplicate skipped), or wasLLM_RATE_LIMITEDtriggered and retrying in the background?"Token cost accounting and slow call governance: "How many Prompt / Completion Tokens did background knowledge distillation (
distillations) and Dreaming aggregation consume respectively? Which slow requests exceededslowThresholdMs?"
Simply click the Trace tab in the top navigation bar of Memory in the Console, and the system will carry the fixed capability tag capability:memory (APPBASE_TRACE_TAGS.capabilityMemory) and jump in one click to the project's observability trace view, enabling end-to-end pinpointing from business X-AppBase-Trace-Id, jobId, userId down to millisecond-level Span waterfalls and LLM Generation payloads.
Core Concepts and Architecture
Memory call chain tracing uses a unified distributed tracing context (W3C traceparent / X-Trace-ID -> X-AppBase-Trace-Id) to link the synchronous API ingestion plane, the async queue and Pipeline Worker plane, the OceanBase storage and retrieval plane, and the Models / LLM Gateway model invocation plane into a complete OpenTelemetry / Langfuse Trace Tree:
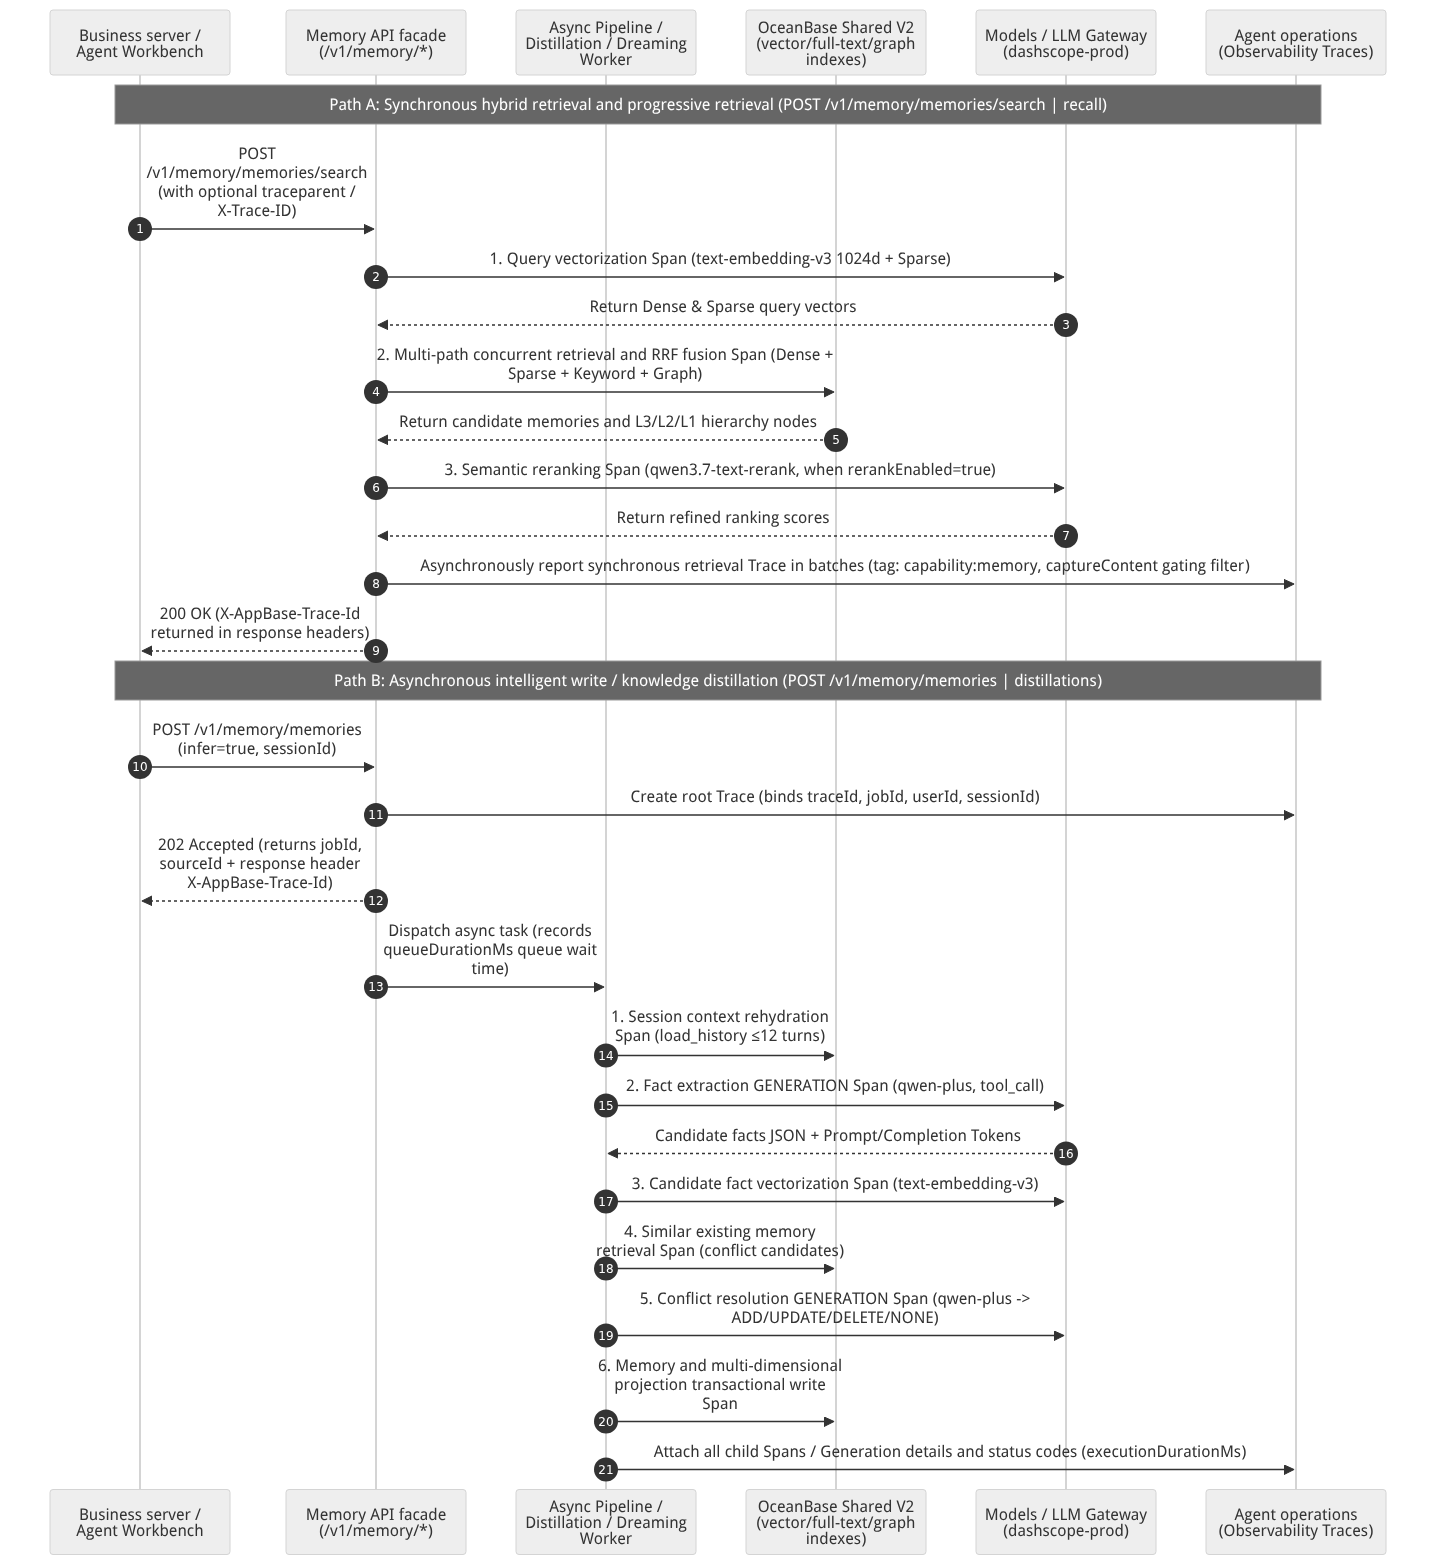
Flow diagram, not a runtime screenshot; read the relationships between steps or states along the arrows.
View the flow diagram in full size
1. End-to-End Trace ID Propagation and Association Protocol
Agentbase Memory follows deterministic Trace ID inheritance and return rules on all /v1/memory/* APIs:
| Propagation Stage | Header / Field Name | Format Specification and Priority Rules | Production Troubleshooting Purpose |
|---|---|---|---|
| Inbound request header (priority 1) | traceparent | Standard W3C Trace Context format (00-<32hex trace-id>-<16hex parent-id>-<2hex flags>) | When upstream microservices or the agent orchestration layer already have OpenTelemetry enabled, Memory automatically extracts the 32-digit hexadecimal trace-id within it as the associated Trace ID for this memory operation, achieving unified tracing across the full stack. |
| Inbound request header (priority 2) | X-Trace-ID | 32-digit non-all-zero lowercase hexadecimal string (^[0-9a-f]{32}$) | When traceparent is not passed, a valid X-Trace-ID explicitly passed by the caller is adopted preferentially. |
| Outbound response header (authoritative receipt) | X-AppBase-Trace-Id | 32-digit non-all-zero lowercase hexadecimal string (e.g., 7a8c9d0e1f2a3b4c5d6e7f8a9b0c1d2e) | If the caller does not pass the above request headers, the platform automatically generates a brand-new Trace ID and uniformly returns it via X-AppBase-Trace-Id in all successful response headers; during async retries (attempt 1..N), the same jobId always reuses the same root Trace ID. |
| Capability filter tag | capability:memory | Frontend constant APPBASE_TRACE_TAGS.capabilityMemory | Automatically applied to all root Traces produced by managed Memory, supporting one-click Console filtering and independent memoryOnly Metrics cost accounting. |
2. Span Tree Structure Breakdown: Synchronous Retrieval vs. Async Write/Distillation
In the waterfall diagram of the Trace detail drawer, different business paths present standardized hierarchical Span tree structures:
| Business Chain Type | Core Stage Span / Generation Node Names | Observation Type (type) | Associated Model / Storage Components | Key Observation Attributes and Diagnostic Metrics |
|---|---|---|---|---|
| Synchronous hybrid search and retrieval ( search / recall) | memory.query_rewrite (when profile rewriting is enabled) | GENERATION | dashscope-prod / qwen-plus | Records the raw query, the query terms after user_zhangwei_001 profile rewriting, and Token consumption. |
memory.embedding.query | SPAN | dashscope-prod / text-embedding-v3 | Records the encoding latency of the 1024-dimensional dense vector and Sparse vector (supports queryEmbeddingCache cache hits). | |
memory.storage.hybrid_query | SPAN | OceanBase Shared V2 | Records the durations of vector HNSW scans, full-text search, 2-hop graph traversal (graph), and RRF fusion on project-exclusive table groups _<projectSequence>. | |
memory.rerank (when policy.rerankEnabled=true) | SPAN | dashscope-prod / qwen3.7-text-rerank | Records rerank duration and score distribution for candidate sets; if reranking times out and degrades, records degraded.rerank=true. | |
| Async write / distillation / Dreaming ( infer=true / distillations / contexts/runs) | memory.job.queue_wait | SPAN (or metadata) | Async task queue | Records queueDurationMs (the queueing wait in milliseconds from HTTP 202 enqueue until the Worker actually starts execution). |
memory.media.parse (on multimodal writes) | GENERATION | dashscope-prod / qwen-vl-max | Records the parse duration and extracted byte count for PNG/JPEG/WebP/PDF files in agent_multimedia_bucket. | |
memory.pipeline.fact_extractionmemory.pipeline.skill_extractionmemory.pipeline.experience_extraction | GENERATION | dashscope-prod / qwen-plus (tool_call) | Records the full Prompt/Completion of LLM calls during the extraction stage (controlled by the captureContent dual gate), first-token latency, and token details. | |
memory.pipeline.conflict_detectionmemory.pipeline.skill_merge | GENERATION | dashscope-prod / qwen-plus | Records the ADD / UPDATE / DELETE / NONE / MERGE decision actions output after comparison with existing similar memories/skills. | |
memory.ingest.stage_failed (fault diagnosis node) | EVENT / SPAN | Fault stage locator | When any stage errors, records errorClass, errorCode (e.g., LLM_RATE_LIMITED, LLM_TIMEOUT, LLM_INVALID_JSON), retryable, and gatewayStatus. |
Feature Entrypoints and Permission Matrix
The Console entry point is located at: Project enterprise-ai-hub-210 → Memory → Trace tab; clicking it routes directly to /console/project-{region}-enterprise-ai-hub-210/observability/traces?tag=capability%3Amemory.
| Function action | Console UI entry and route | REST API endpoint | Server SDK / header contract | Required RBAC / API Key Scope | Cross-module associated dependency |
|---|---|---|---|---|---|
| One-click jump from the memory workbench to the trace page | Memory → Trace tab (routes to /observability/traces?tag=capability%3Amemory) | GET /v1/observability/traces?tag=capability:memory | Console route navigation | Console member + observability.traces.read | Integration Agent Ops → Trace |
| View the Span waterfall of a single Trace | Click the target Trace row in the trace list to expand the detail drawer | GET /v1/observability/traces/{traceId} | HTTP GET | observability.traces.read | Displays memory.model.call and OceanBase retrieval sub-Spans |
| Configure Memory observability sampling and slow threshold | Memory → Configuration → Basic Configuration (policy) | GET/PUT /v1/projects/{projectId}/memory/config/policy | Control-plane HTTP API | Console administrator or projects.write | Management observability.enabled, successSampleRate, slowThresholdMs, captureContent |
| Count only Memory cost and latency on the metrics dashboard | Agent Ops → Metrics → Memory only (memoryOnly) | GET /v1/observability/metrics?memoryOnly=true | HTTP GET | observability.metrics.read | Integration Metrics monitoring and analysis reports |
| Cross-check business request receipts against task final states | Memory → Audit tab (?tab=audit) | GET /v1/memory/audits, GET /v1/memory/jobs/{jobId} | memory.listAudits / memory.getJob | memories.read | Forms a troubleshooting closed loop with Memory Audit Logs |
Feature Details and Operation Guide
Step One: One-click jump from the Memory console and filter traces by capability:memory
Log in to the Agentbase Console, go to the flagship project
企业智能客服与知识中台(enterprise-ai-hub-210) under organizationAgentbase 企业智能中台(69c6d1aa00062e6bb60), and click Memory in the left navigation bar.In the horizontal tab bar at the top of the memory workbench (
记忆|画像|经验与技能|模型|上下文|配置|审计|Trace), click the rightmost Trace tab.The browser automatically jumps to
/console/project-{region}-enterprise-ai-hub-210/observability/traces?tag=capability%3Amemory, and the filter bar at the top of the page has thetag = capability:memoryfilter condition auto-applied, showing only synchronous retrieval and async pipeline traces generated by the Memory service for the current project.In the filter area at the top of the list, you can further stack refined locating conditions:
Trace ID search: paste the
X-AppBase-Trace-Idreturned in the business response header (e.g.,7a8c9d0e1f2a3b4c5d6e7f8a9b0c1d2e);User ID filter: enter
user_zhangwei_001oruser_lina_002to view only the memory writes, profile updates, and retrieval traces of a specific customer;Session ID filter: enter a business session identifier (e.g.,
sess_ticket_TK_20261022_001) to view the complete trace sequence of all memory inferences and context retrievals within the same support ticket session.
Step Two: Drill into the Span waterfall (locating latency bottlenecks and skipReason)
Click any Memory Trace record in the list, and the detail panel on the right will display the complete Span tree and stage-duration waterfall. In actual operations, you can quickly locate issues using the following four-step method:
Distinguish
queueDurationMsfromexecutionDurationMs:If async writes or distillation tasks take a long time end to end, first observe the blank waiting segment between the root Trace creation time and the first Worker execution Span (
queueDurationMs). IfqueueDurationMsis significantly high whileexecutionDurationMsis normal, it means the project is performing a large batch import (batch/imports) that triggered background queue peak-shaving, not a slowdown of the model or database.
Locate the main time cost of online hybrid retrieval (
search/recall):Compare the duration shares of three sub-Spans:
memory.embedding.query(callingtext-embedding-v3ofdashscope-prod),memory.storage.hybrid_query(OceanBase vector + full-text + graph retrieval), andmemory.rerank(callingqwen3.7-text-rerank);If
memory.rerankduration approaches or exceeds the budget, check whether the candidate retrieval cap is set too large, or use the progressive retrievaldeadlineMs: 450to enforce a hard timeout protection.
Understand when the LLM
GENERATIONnode (skipReason) will not appear:When viewing a direct
infer=falsewrite, a compliance record withhandlingPolicy="no_model"set, or an online retrieval with profile rewriting (profileRewriteEnabled=false) not enabled, the absence of anGENERATIONLLM generation node in the Span tree is completely expected normal behavior; Span metadata clearly records the skip reason (e.g.,skipReason: "request_infer_false"or"policy_no_model").
Locate async task failures and retries (
memory.ingest.stage_failed):When a
infer=truewrite or knowledge distillation triggers retries due to upstream model rate limiting (HTTP 429), multiple attempts of the samejobId(attempt=1, 2...) are aggregated under the same root Trace; expand thememory.model.callormemory.ingest.stage_failednode marked with warning/error to directly readerrorCode(e.g.,LLM_RATE_LIMITED,LLM_INVALID_JSON),retryable: true/false, andgatewayStatus.
Step Three: Configure the privacy content capture dual gate (captureContent) and intelligent sampling policy
In enterprise production environments, not all projects want customer raw conversations and memory content written into observability trace logs; meanwhile, ultra-high-concurrency projects also do not need full Trace collection for 100% of routine fast successful requests. Agentbase Memory provides fine-grained sampling and privacy control switches in policy.observability (located at /v1/projects/{projectId}/memory/config/policy):
| Configuration field path | Type | Default value / range | Governance semantics and effective mechanism |
|---|---|---|---|
policy.observability.enabled | boolean | true | Project-level Memory Trace export switch (requires the platform-global agentops.enabled=true to be enabled simultaneously). |
policy.observability.successSampleRate | number | 0.0 ~ 1.0 (default 1.0) | Sampling rate for ordinary successful requests. For example, setting it to 0.2 means successful requests with normal durations are sampled with a 20% probability. Note: failed requests (Error) and slow requests exceeding the slow threshold (Slow) are not dropped by the sampling rate and are always collected with priority. |
policy.observability.slowThresholdMs | integer | Positive integer (e.g., 800 ms) | Forced tracing threshold for slow requests. Even if successSampleRate is set very low, as long as a Memory operation exceeds slowThresholdMs in duration, the system automatically escalates sampling to ensure slow queries always have a trace available for inspection. |
policy.observability.captureContent | boolean | false / true | Project-level switch of the content capture dual gate: only when the platform-level environment variable switches (observability.captureContent / agentops.memoryCaptureContentEnabled) and the project-level switch policy.observability.captureContent are true simultaneously will memory content and Prompt inputs/outputs be recorded in Span and Generation nodes; as long as any gate is false, all business text payloads are automatically replaced with [REDACTED] before persistence, retaining only durations, token counts, and status codes. |
Step Four: Inject a custom Trace ID via request headers and verify with API queries
The following demonstrates how to proactively pass W3C traceparent when calling the Memory search API on the business service side (or read the returned X-AppBase-Trace-Id), and then query the complete trace details via the observability REST API:
export APPBASE_ENDPOINT="https://appbuild.oceanbase.com/v1"
export APPBASE_PROJECT_ID="enterprise-ai-hub-210"
export APPBASE_API_KEY="<APPBASE_API_KEY>"

# 1. Call the hybrid retrieval endpoint, pass a custom W3C traceparent and capture the X-AppBase-Trace-Id in the response headers
curl -fsS -D /tmp/memory_trace_headers.txt \
  -X POST "${APPBASE_ENDPOINT}/memory/memories/search" \
  -H "X-Appwrite-Project: ${APPBASE_PROJECT_ID}" \
  -H "X-Appwrite-Key: ${APPBASE_API_KEY}" \
  -H "traceparent: 00-7a8c9d0e1f2a3b4c5d6e7f8a9b0c1d2e-1a2b3c4d5e6f7a8b-01" \
  -H "Content-Type: application/json" \
  --data '{
    "userId": "user_zhangwei_001",
    "scope": "user",
    "query": "OceanBase Shared V2 向量索引 HNSW 参数与排障偏好",
    "searchMode": "hybrid",
    "limit": 5
  }' | jq .

# Extract the authoritative X-AppBase-Trace-Id from the response headers
TRACE_ID="$(grep -i '^x-appbase-trace-id:' /tmp/memory_trace_headers.txt | awk '{print $2}' | tr -d '\r')"
echo "Captured X-AppBase-Trace-Id: ${TRACE_ID}"

# 2. Query the project's Memory trace list by the capability:memory tag and userId
curl -fsS --get "${APPBASE_ENDPOINT}/observability/traces" \
  -H "X-Appwrite-Project: ${APPBASE_PROJECT_ID}" \
  -H "X-Appwrite-Key: ${APPBASE_API_KEY}" \
  --data-urlencode "tag=capability:memory" \
  --data-urlencode "userId=user_zhangwei_001" \
  --data-urlencode "limit=10" | jq .

# 3. Using the captured TRACE_ID, query the complete Span waterfall tree of a single Trace along with Generation token details
curl -fsS "${APPBASE_ENDPOINT}/observability/traces/${TRACE_ID}" \
  -H "X-Appwrite-Project: ${APPBASE_PROJECT_ID}" \
  -H "X-Appwrite-Key: ${APPBASE_API_KEY}" | jq .
FAQ (Frequently Asked Questions and Troubleshooting)
1. Why do I see successful request records in "Memory → Audit" but cannot find the corresponding X-AppBase-Trace-Id in the trace list after clicking "Trace"?
Cause analysis: Check the following three points: ① Traces are reported asynchronously in non-blocking batch pipelines, with an ingestion visibility delay of 1–5 seconds under high load; ② Check whether
policy.observability.enabledin Memory → Configuration → Basic Configuration (policy) is enabled, and whethersuccessSampleRateis less than1.0(when the sampling rate is below 100% and the request duration is underslowThresholdMs, the trace may not be exported per sampling rules); ③ The Time Range window at the top of the page or theuserIdfilter condition is too narrow.Solution: Never assert that a memory request was not executed merely because a trace missed sampling — to determine whether a business request was executed and its final status, always rely on Memory Audit Logs (
GET /v1/memory/audits) and async task queries (GET /v1/memory/jobs/{jobId}). If you need to capture every request during debugging, setpolicy.observability.successSampleRateto1.0.
2. Why do the Prompt input and model output show as [REDACTED] when opening the Generation node of a Memory Trace?
Cause analysis: To protect enterprise customers' private conversations and highly sensitive memory content, Memory Trace enforces a strict dual
captureContentgate (platform-levelobservability.captureContent/agentops.memoryCaptureContentEnabledand project-levelpolicy.observability.captureContent). As long as any one of these switches isfalse, the system automatically erases content payloads and replaces them with[REDACTED]when constructing observation Spans, and performs recursive masking on fields marked as highly sensitive or compliance-restricted.Solution: If you need to view the full Prompt and extraction JSON during pre-release debugging or in compliance-authorized projects, have the project administrator go to Memory → Configuration → Basic Configuration (
policy), setobservability.captureContenttotrue, and save.
3. Why do the model call counts and Token consumption shown in “Agent Operations → Metrics” appear higher than the statistics of calling the Chat API directly from business code?
Root cause: When the project has enabled
infer=trueintelligent memory extraction, automatic user profiling (autoProfileExtractionEnabled), Dreaming context aggregation (dreaming.enabled), or experience skill distillation (autoDistillEnabled), the Memory background Worker invokesqwen-plus,text-embedding-v3,qwen3.7-text-rerank, andqwen-vl-maxunderdashscope-prod. These calls tagged withcapability:memoryare also counted toward the project's total Tokens and call volume through the project model gateway.Solution: Go to the Agent Operations → Metrics page and turn on the Memory only (
memoryOnly) toggle to isolate Memory-generated model calls, Token consumption, and latency percentiles for dedicated cost accounting.