
Observability Overview (AgentOps)
Feature Overview
AI Observability (the Console left navigation section is named AgentOps / Agent Ops) is Agentbase's (v2.10.0) full-chain tracing, quality evaluation, annotation review, and cost measurement platform built for enterprise-grade large model and agent applications. In complex agent production systems, a single user request often spans multiple subsystems, including the Agent Runtime, AI Gateway, Knowledge Base RAG, and long-term Memory, involving multiple large model generations and tool executions. Traditional APM monitoring can only see HTTP status codes and API latency, and cannot provide insight into Prompt quality, retrieval relevance, hallucination risk, or Token cost attribution.
In the flagship project 企业智能客服与知识中台 (enterprise-ai-hub-210) of Agentbase 企业智能中台 (69c6d1aa00062e6bb60), AgentOps provides a complete closed loop from collection, observation, to evaluation and governance:
Dual-channel unified telemetry collection: simultaneously supports standard OpenTelemetry OTLP protocol reporting and
/v1/observability/ingestionbatch event ingestion, automatically aggregating platform managed capabilities (capability:agent,capability:rag,capability:memory) and external custom SDK reporting (agentbase-external);Full-dimension domain model: builds a unified view around Trace (end-to-end chain), Observation (fine-grained nodes: Span / Generation / Event / Agent / Tool), Session (multi-turn conversation), User (end user), Prompt (prompt version), Score (multi-dimensional scoring), Dataset (evaluation benchmark set), and Metrics / Reports (metrics and analysis reports);
Enterprise-grade data governance: provides project-level data retention settings (
/v1/observability/settings/data-retention), automatic masking of sensitive credentials ([REDACTED]), and fine-grained RBAC permission control.
Core Concepts and Architecture
Agentbase Observability adopts a layered architecture of "Agentbase unified authentication and control plane + high-performance trace storage and asynchronous evaluation engine". Browsers and client SDKs interact only through the /v1/observability/* public gateway, where the platform strictly validates project ownership and Scope permissions.
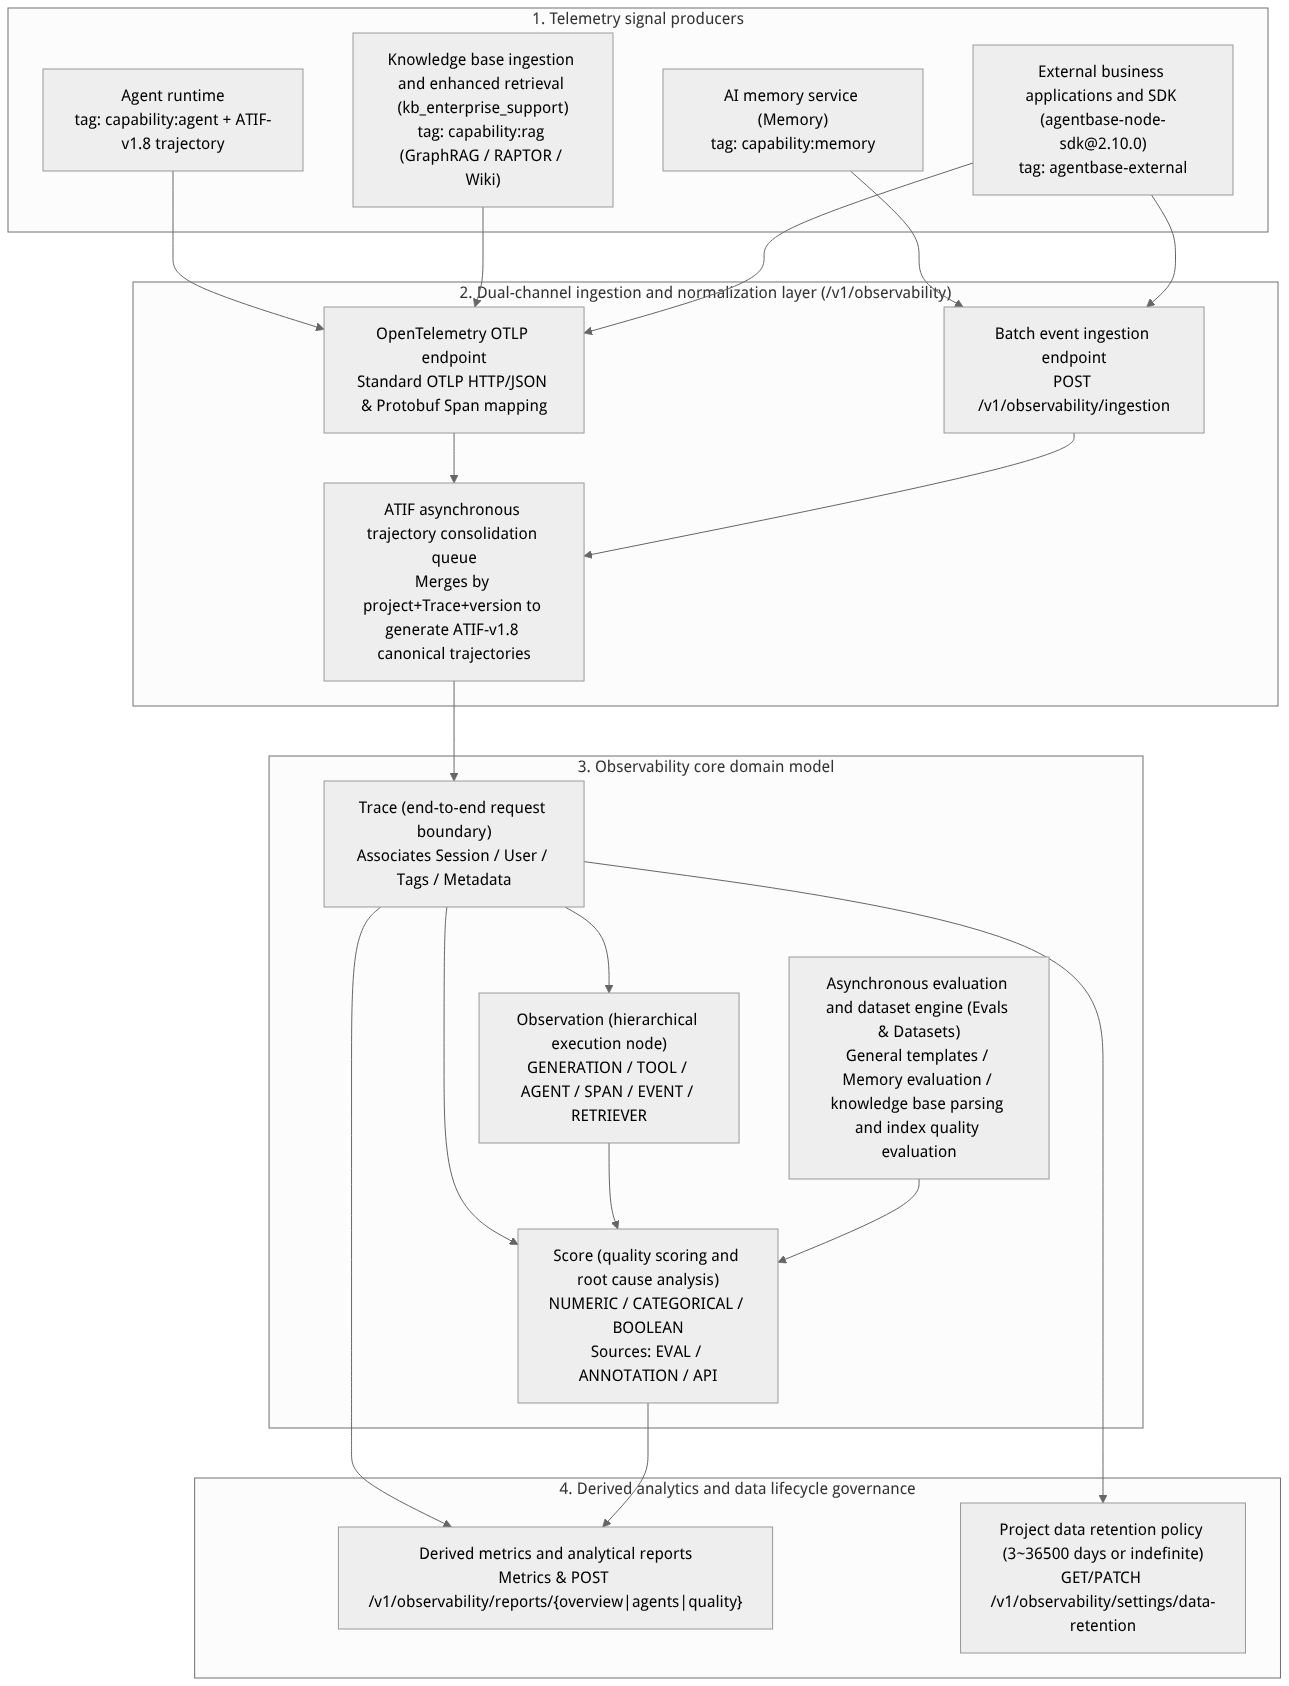
Flow diagram, not a runtime screenshot; read the relationships between steps or states along the arrows.
View the flow diagram in full size
Core Data Model Definition Table
| Domain entity | Key identifiers and hierarchy | Core attributes and technical semantics |
|---|---|---|
| Trace (call chain) | traceId (top-level root container) | Represents one end-to-end business request (such as a single complete Q&A round of an intelligent customer service handling support ticket TK-20261022-001). Mounts userId, sessionId, name, input, output, tags, metadata, and persisted ATIF-v1.8-compliant traces. |
| Observation (observation node) | observationId (forms a tree via parentObservationId) | Concrete execution steps within a Trace. Supports 10 standard types: GENERATION (large model call, including model name, token details, and cost), TOOL (tool call), AGENT (agent orchestration step), SPAN (generic duration span), EVENT (instantaneous event), RETRIEVER (knowledge/memory retrieval), EMBEDDING, CHAIN, EVALUATOR, GUARDRAIL. |
| Session (multi-turn conversation) | sessionId (aggregates multiple Traces) | Chains multiple Traces within the same conversation window in chronological order, and aggregates the total duration, total token usage, and user satisfaction score of the entire session. |
| User (end user) | userId (e.g. user_zhangwei_001) | Aggregates by business user dimension all historically initiated Traces, Observation counts, cumulative token consumption, estimated cost, and score distribution. |
| Score (quality score) | scoreId (bound to traceId and optional observationId / sessionId) | Measures the quality of a single generation or an entire chain. Supports NUMERIC (numeric, automatically computes the 0~1 normalized value per configuration normalizedValue), CATEGORICAL (categorical), BOOLEAN (boolean); sources are divided into EVAL (automated evaluation), ANNOTATION (manual annotation), and API (external reporting). |
| Prompt (prompt asset) | promptId / name + version / label | Centrally manages versioned prompt templates (including labels such as production), and supports deterministic resolution at inference or evaluation time via GET /v1/observability/prompts/resolve. |
Roles, Entry Points, and Relationships
Console Page Structure and Four Navigation Sections
In project enterprise-ai-hub-210, expand Observability / AgentOps in the left navigation bar. The system organizes all subpages into four major business sections:
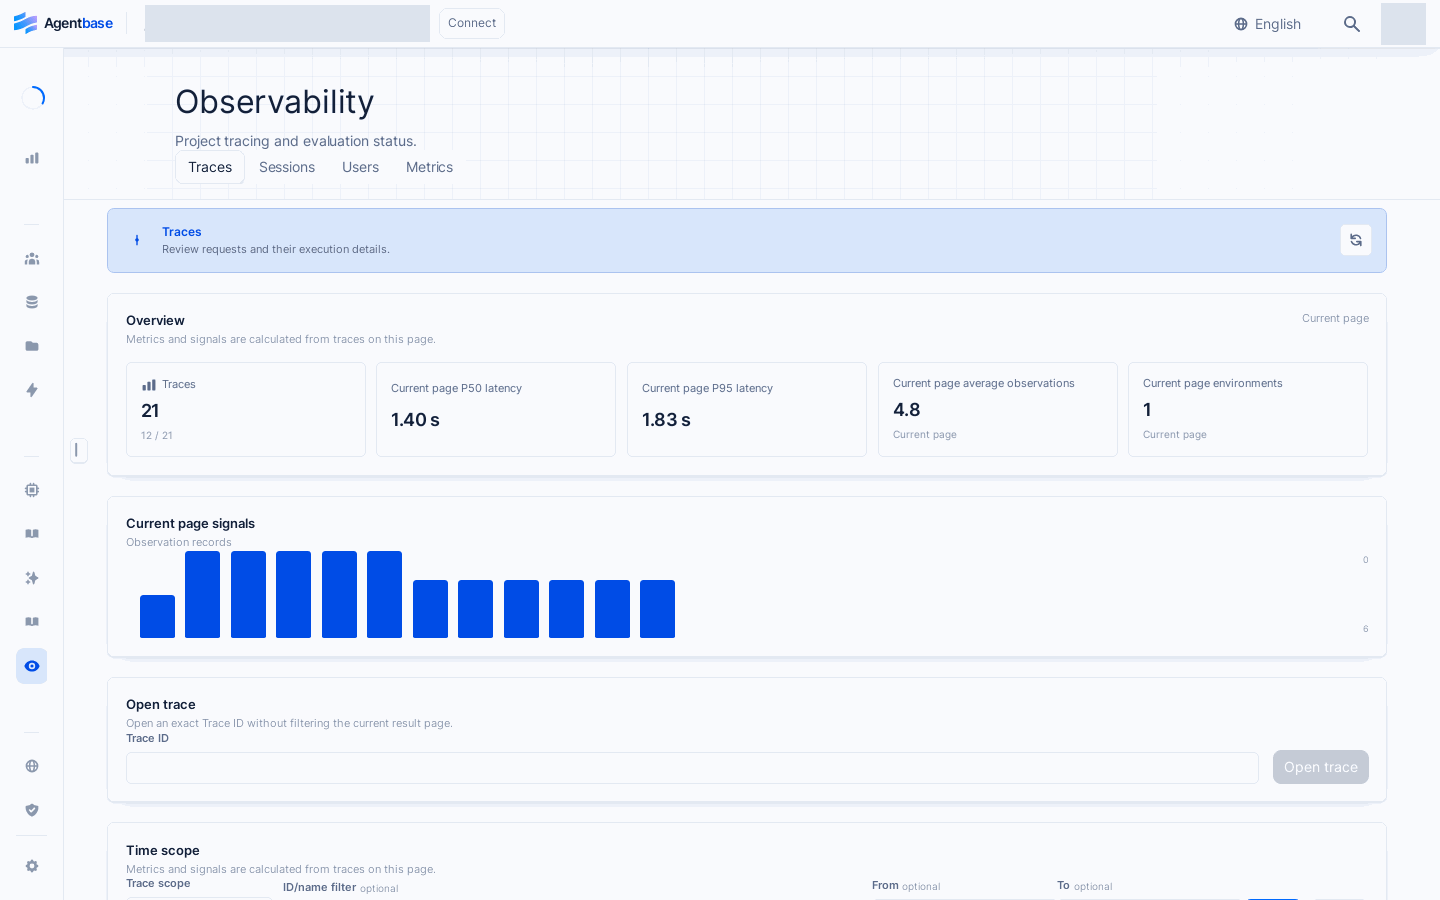
Interface reference: reuses previously registered historical screenshots; demo data may differ from the current project; no new screenshots were taken this time.
| Section name | Page name | Console route suffix | Core functionality description | Required permission Scope |
|---|---|---|---|---|
| Observation | Traces | /observability/traces | Default landing page. Filter traces by scope labels, user, or name, and view ATIF traces, observation trees, and waterfall diagrams. | observability.traces.read |
| Observation | Observations | /observability/observations | Flat search across Traces for all Observation nodes in the project, with stable pagination by multiple types, levels, environments, and time windows. | observability.traces.read |
| Observation | Sessions / Users | /observability/sessions · /users | Aggregate multiple related traces by session, or drill down into behavior and cost by end user (e.g. user_zhangwei_001). | observability.sessions.read / observability.users.read |
| Observation | Metrics | /observability/metrics | Dashboards of trace-derived latency percentiles (P50/P95/P99), token usage, model cost, and score trends. | observability.metrics.read |
| Observation | Data Settings | /observability (Data Settings entry) | Configure project-level observation data retention (3–36,500 days or unlimited retention). | observability.settings.read / write |
| Prompts | Prompts | /observability/prompts | Versioned management of prompt templates, online Playground experimentation, and deterministic /resolve resolution. | observability.prompts.read / write |
| Evaluations | Evals & Evaluation Skills | /observability/evals · /evaluation-skills | Built-in and custom evaluation templates, knowledge base parsing and index quality evaluation tasks (general/Memory/knowledge base), and read-only evaluation skill package management. | observability.evals.read / write |
| Evaluations | Scores & Score Settings | /observability/scores · /score-settings | View automated and manual scores, five-tier normalized distribution, low-score root cause analysis (RCA), and maintain score configurations. | observability.scores.read / write |
| Evaluations | Annotations | /observability/annotations | Create manual annotation queues, assign project members to claim leases, and review/score Traces/Observations/Sessions. | observability.annotations.read / write / submit |
| Assets / Data (data assets) | Datasets | /observability/datasets | Manage golden evaluation datasets (such as enterprise-support-golden-v1), import CSVs, and trigger benchmark comparison runs. | observability.datasets.read / write |
| Assets / Data (data assets) | Reports | /observability/reports/overview (and /agents, /quality) | Fixed-window (24h/7d/30d or custom ≤30d) dashboards for usage, cost, ROI, and Bad Case attribution (sidebar entry hidden by default, accessed via direct URL). | observability.metrics.read + traces.read + scores.read |
Deep Integration with the Platform's Four AI Capabilities
Integration with the Agent Runtime: When the platform enables
agentops.runtimeExportEnabled, the Agent Runtime automatically exports each ReAct run as a Trace tagged withcapability:agentand asynchronously consolidates it into a standardized execution trace conforming toATIF-v1.8; dataset evaluations can also directly use the Agent Runtime as an evaluation target to trigger batch replays.Integration with the Knowledge Base (Knowledge Base
kb_enterprise_support):Ingestion and build tracing: when the platform enables
agentops.ingestionTracingEnabledand the knowledge base enablestracingEnabled, document parsing, chunking, and GraphRAG / RAPTOR / LLM Wiki index construction each generate an independent Trace, directly supporting knowledge base parsing and index quality evaluation;Enhanced retrieval tracing: every time
/v1/knowledge-base/{kbId}/searchis called, in addition to the basicembed_query,search, andreranknodes, the system records under the same Trace theretrieval.statusofgraphragandwikichild nodes (not_requested/not_ready/succeeded/degraded/failed), returned entry counts, and per-stage durations.
Integration with long-term Memory: Every Memory write, retrieval, profile extraction, and experience distillation is automatically tagged with
capability:memoryand returns theX-AppBase-Trace-Idresponse header; clicking the Trace tab in the Memory Console jumps into the trace page with filters applied in one click, and the Metrics dashboard supports one-click enabling ofmemoryOnly-specific filtering.
Feature Details and Operation Guide
1. Dual-Channel Ingestion: OpenTelemetry OTLP and /v1/observability/ingestion
In addition to automatic reporting by platform managed components, business applications can report call chains from custom agents or backend microservices to the project's enterprise-ai-hub-210 via the following two standard channels:
Channel One: Using the /v1/observability/ingestion Batch Event Ingestion API
Suitable for reporting structured trace-create, generation-create, span-create, and score-create event batches directly via REST API or agentbase-node-sdk@2.10.0:
export APPBASE_ENDPOINT="https://appbuild.oceanbase.com/v1"
export APPBASE_PROJECT_ID="enterprise-ai-hub-210"
export APPBASE_API_KEY="<APPBASE_API_KEY>"

# Batch-report a customer support ticket handling Trace with its internal qwen-plus Generation node
curl -fsS -X POST "${APPBASE_ENDPOINT}/observability/ingestion" \
  -H "X-Appwrite-Project: ${APPBASE_PROJECT_ID}" \
  -H "X-Appwrite-Key: ${APPBASE_API_KEY}" \
  -H "Content-Type: application/json" \
  --data '{
    "batch": [
      {
        "id": "evt_trace_20261022_001",
        "type": "trace-create",
        "timestamp": "2026-10-22T10:15:00.000Z",
        "body": {
          "id": "tr_support_ticket_20261022_001",
          "name": "enterprise-ticket-triage",
          "userId": "user_zhangwei_001",
          "sessionId": "sess_ticket_TK_20261022_001",
          "input": "工单 TK-20261022-001:核心账务集群 HNSW 向量索引重建报 -4013 内存不足",
          "output": "已定位为 ob_vector_memory_limit_percentage 配额不足,建议调升至 30%",
          "tags": ["capability:agent", "sla:P0-VIP"],
          "environment": "production",
          "metadata": {
            "ticketId": "TK-20261022-001",
            "gatewayId": "gw_7194685489feb1e169548619"
          }
        }
      },
      {
        "id": "evt_gen_20261022_001",
        "type": "generation-create",
        "timestamp": "2026-10-22T10:15:00.120Z",
        "body": {
          "id": "obs_gen_qwen_plus_001",
          "traceId": "tr_support_ticket_20261022_001",
          "name": "qwen-plus-diagnosis",
          "startTime": "2026-10-22T10:15:00.120Z",
          "endTime": "2026-10-22T10:15:01.480Z",
          "model": "qwen-plus",
          "input": [{"role": "user", "content": "排查 OB -4013 向量内存错误"}],
          "output": {"role": "assistant", "content": "请检查 GV$OB_VECTOR_MEMORY_INFO 并调高 ob_vector_memory_limit_percentage。"},
          "usage": {
            "input": 420,
            "output": 185,
            "total": 605,
            "unit": "TOKENS"
          },
          "metadata": {
            "cache": {"status": "miss"}
          }
        }
      }
    ]
  }' | jq .
Channel Two: Ingestion via the OpenTelemetry OTLP Standard Protocol
For applications already integrated with the OpenTelemetry SDK (Node.js / Python / Go / Java), you can configure the OTLP HTTP Exporter to point to the project's OTLP receiving endpoint, carrying the project header X-Appwrite-Project: enterprise-ai-hub-210 and an API Key with observability.traces.write permission; the platform automatically maps OpenTelemetry GenAI semantic convention attributes (gen_ai.system, gen_ai.request.model, gen_ai.usage.*) to standard GENERATION and TOOL observation nodes.
2. Cross-Trace Observation List (Observations) and Metrics Dashboard
In the left navigation bar, click Agent Ops → Observations to open the cross-trace observation records list page. This page allows skipping the top-level Trace and filtering all fine-grained execution nodes directly by observation name (
name), observation type (GENERATION,TOOL,AGENT,RETRIEVER, etc., with multi-select), log level (DEFAULT,DEBUG,WARNING,ERROR),traceId,environment, and start/end time.
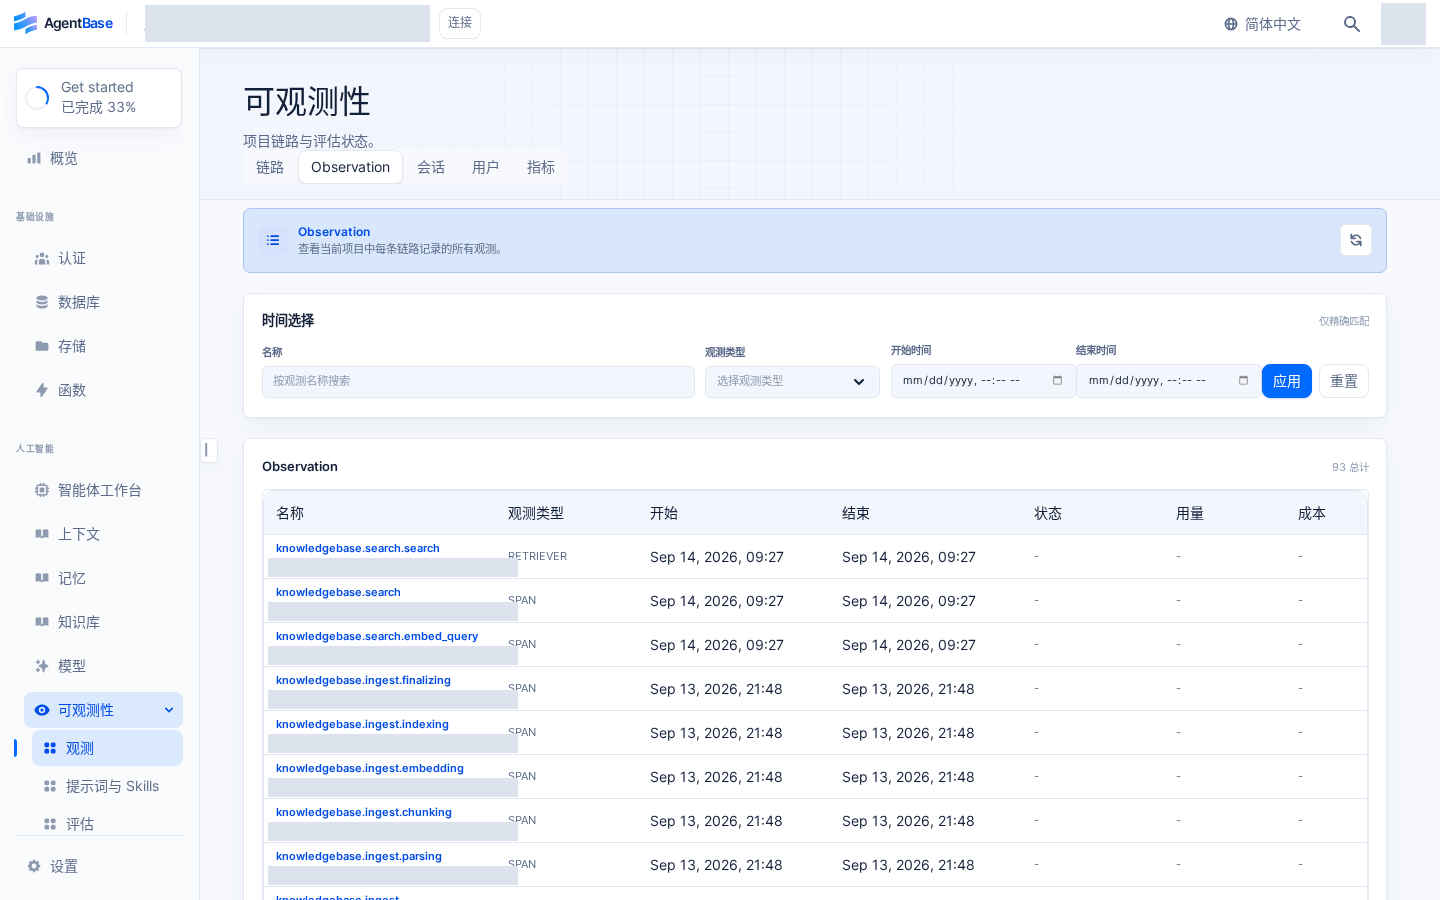
Interface reference: reuses previously registered historical screenshots; demo data may differ from the current project; no new screenshots were taken this time.
In the left navigation bar, click Agent Ops → Metrics to view call volume, P50/P95/P99 latency, Token consumption, model cost estimates, and quality score distributions derived in real time from traces.
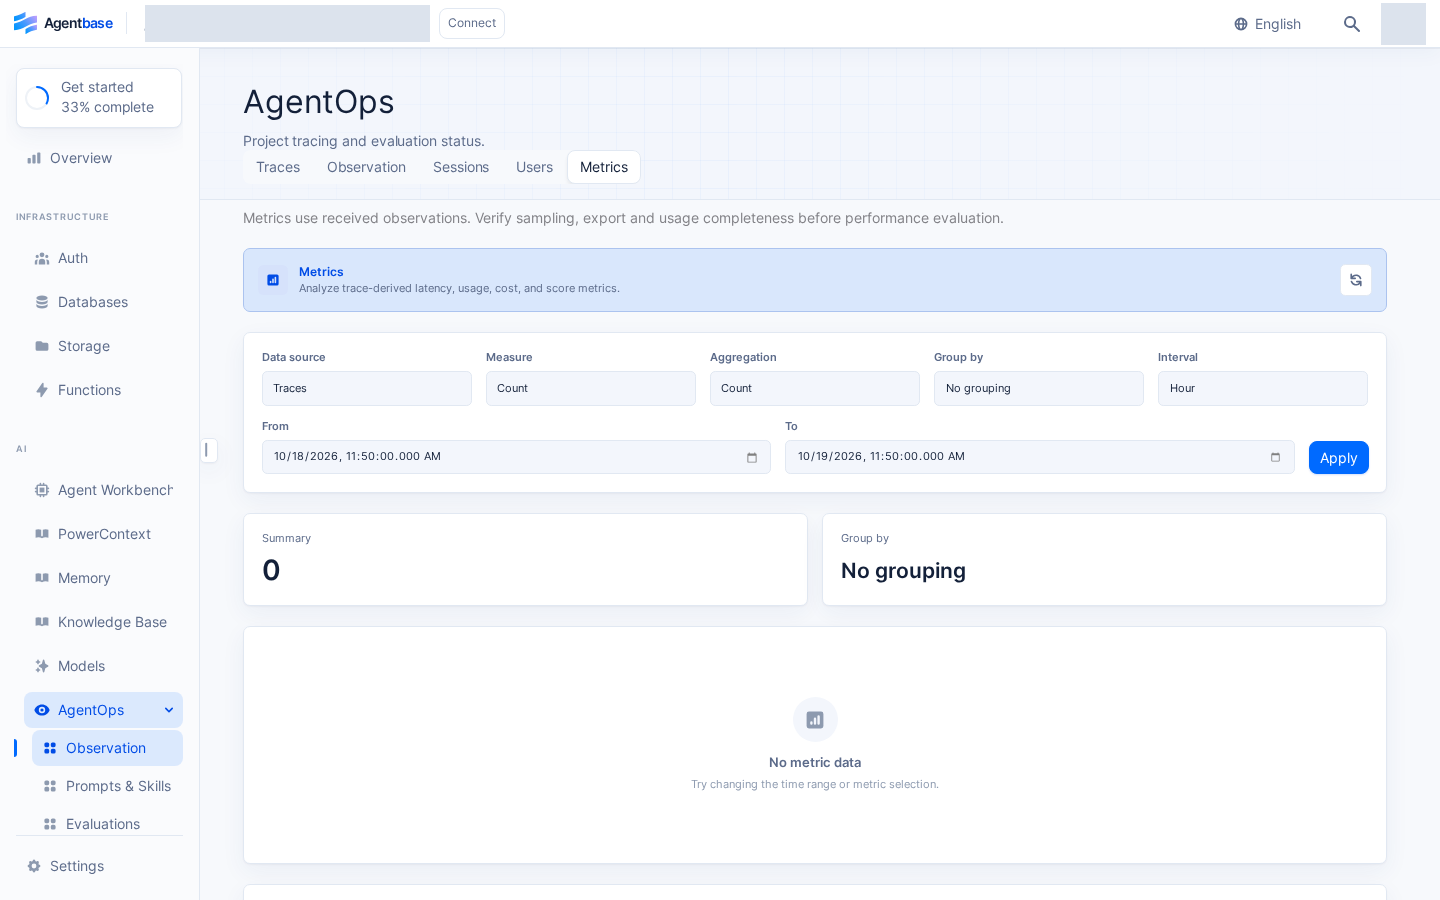
Interface reference: reuses previously registered historical screenshots; demo data may differ from the current project; no new screenshots were taken this time.
3. Configure the project-level observability data retention policy (Data Retention)
According to compliance audit requirements and storage cost budgets, enterprises can configure the retention period of the current project's observable data in Agent Ops → Observations → Data Settings (corresponding to the control plane API GET/PATCH /v1/observability/settings/data-retention):
| Parameter field | Type | Value range and default | Governance rules and safety boundaries |
|---|---|---|---|
retentionDays | integer | null | Default null (retain indefinitely); finite retention supports an integer number of days within 3 ~ 36500 (passing 0 or null is both normalized to indefinite retention) | Covers the current project's Traces, Observations, Scores, and associated analysis artifacts and media. Saving only updates the retention policy; a background scheduled job purges expired data daily, and no synchronous blocking deletion occurs at the moment of saving. |
expectedRevision | string | The GET string returned by the most recent revision response | Optimistic-lock concurrency protection. Every time a finite retention period is saved, the Console pops up an irreversible cleanup risk confirmation dialog; once historical data has been purged, it cannot be recovered by later increasing the number of days or switching back to indefinite retention. |
# Query and update the observability data retention policy of project enterprise-ai-hub-210 to 180 days
RET_DATA="$(curl -fsS "${APPBASE_ENDPOINT}/observability/settings/data-retention" \
  -H "Cookie: ${APPBASE_CONSOLE_SESSION}" \
  -H "X-Appwrite-Project: enterprise-ai-hub-210" \
  -H "X-Appwrite-Mode: admin")"

REV="$(echo "${RET_DATA}" | jq -er '.revision')"

curl -fsS -X PATCH "${APPBASE_ENDPOINT}/observability/settings/data-retention" \
  -H "Cookie: ${APPBASE_CONSOLE_SESSION}" \
  -H "X-Appwrite-Project: enterprise-ai-hub-210" \
  -H "X-Appwrite-Mode: admin" \
  -H "Content-Type: application/json" \
  --data "{
    \"retentionDays\": 180,
    \"expectedRevision\": \"${REV}\"
  }" | jq .
4. Platform-global observability switches (reference for instance administrators)
In the platform admin backend (the Agent Ops tab of /_internal/admin), instance administrators control the capability boundaries of the entire platform through 4 global dynamic configuration keys (after modification, changes sync to all PHP Worker, Memory, and Agent Runtime processes within about 5 minutes 30 seconds):
| Platform configuration key | Environment default value variable | Description of effect |
|---|---|---|
agentops.enabled | _APP_LANGFUSE_ENABLED | Platform-wide master observability switch, controlling module entry, the /v1/observability/* API, and internal service Trace export. |
agentops.ingestionTracingEnabled | _APP_KNOWLEDGE_BASE_INGESTION_TRACING_ENABLED (default enabled) | Globally allows knowledge base ingestion and knowledge index build tracing (the knowledge base's own tracingEnabled=true is still required). |
agentops.runtimeExportEnabled | AGENTOPS_LANGFUSE_ENABLED | Controls Trace export and dataset run association for the Agent Workbench (Agent Runtime). |
agentops.memoryCaptureContentEnabled | MEMORY_OBSERVABILITY_CAPTURE_CONTENT_ENABLED (default true) | Globally allows Memory to capture body content (the project-level policy.observability.captureContent=true is still required). |
Select a Prompt Version and View Usage Instructions
In Observability / AgentOps → Prompts, open the target Prompt and switch to Usage in the details. The current project must already have a readable Prompt; when providing read credentials to business applications, grant only the required Prompt read permission, and do not write secrets into Prompt content or example variables.
First select a tag or a fixed version, then select the curl, Python, or TypeScript example.
Check the version and variables displayed on the page. When switching versions, wait for the content to finish loading; if loading fails, first verify whether the current project, permissions, and version exist, and do not copy examples from an old version as a substitute.
Replace the endpoint and credential placeholders as instructed on the page, and confirm the project ID is correct. Variable names come from the selected version, and example variable values must be replaced with business inputs.
After running, verify the returned Prompt name, version, body, and variables before integrating it into business calls or evaluations.
| Selection method | Applicable scenarios | Notes |
|---|---|---|
production, latest, or a custom tag | When you want calls to follow the version the tag points to | Tags can be moved and must not be treated as immutable snapshots |
| Fixed version number | Regression evaluation, reproducing a specific answer | Must explicitly use a positive integer version; cannot be specified together with a tag |
When resolving by name, if neither a tag nor a version is specified, production is used by default; this does not mean the latest version is fetched automatically. If you need an earlier historical version, first load the corresponding history page in the version list, then select it in the usage instructions.
Python / TypeScript examples replace variables in text Prompts or chat messages according to the selected version; curl examples only indicate variables and do not perform substitution. Message placeholders in chat Prompts also do not mean a complete conversation has been filled in; handle them according to business requirements before integration. After the Prompt version is verified, you can compare results using the same set of datasets; for quality checks of retrieval-based answers, see Evaluations and Scoring.
FAQ and Troubleshooting
1. Why did I perform an action in the Agent Workbench or knowledge base but do not see a new trace in the Traces list?
Cause analysis: Check the following three layers of switches and sampling configuration: ① whether the platform-global master switch
agentops.enabledand the corresponding sub-switch (agentops.runtimeExportEnabledoragentops.ingestionTracingEnabled) are enabled; ② whether the knowledge base or Memory project's own tracing switch (e.g., knowledge basetracingEnabled, Memorypolicy.observability.enabled) is turned on; ③ whether the asynchronous ingestion queue is still processing (when transient underlying database connection fluctuations occur, the queue automatically enters an exponential backoff cooldown protection of at most 30 seconds, and events are not lost).Resolution: Wait a few seconds and refresh the Traces list; if data is still missing, have the instance administrator check the status of the four global switches and the exporter connection configuration in
/_internal/admin.
2. Why does the Input / Output in Trace details show [REDACTED]? Is this an instrumentation failure?
Cause analysis: This is not a failure. When a content security policy or privacy configuration (for example, disabling
captureContentor hitting a sensitive credential masking rule) removesAuthorization,Cookie, API keys, passwords, or business privacy body content, the system explicitly retains the[REDACTED]marker and notes on the details page that the original value was not stored.Resolution: Never treat
[REDACTED]as telemetry data loss. If you need to view Memory's complete model input and output in a debugging environment, you can enable the platformagentops.memoryCaptureContentEnabledand the projectpolicy.observability.captureContentsimultaneously in a non-sensitive test project.
3. Why do regular project members get 404 project_not_found or 403 when calling GET /v1/observability/settings/data-retention?
Cause analysis: Data retention settings are a highly sensitive management-plane API (
AuthType::ADMIN) and do not support being called with an ordinary business API Key. Additionally, the caller must have access permission to the current project andobservability.settings.read(read) orobservability.settings.write(modify; limited to the projectowner,admin,developer,editorroles). Cross-team access without project visibility uniformly returns404 project_not_foundto prevent project enumeration.Resolution: Please use an account with current project management permissions to operate in the Console, and do not call this settings API with a business API Key in client-side code.