
Memory Audit Logs and Trace Localization
Feature overview and core scenarios
Memory Audit & Trace (the Console tabs are Audit and Trace) is the core observability system for enterprise security and compliance, change tracking, and production performance troubleshooting in Agentbase Memory (v2.10.0). In multi-team environments with frequent agent interactions, operations and architecture teams need clear answers to three types of questions:
Configuration change history tracing: who modified which Memory configuration namespace or Pipeline, when, and for what reason (
reason), and what are the correspondinglastEventIdandETag?Business data-plane operation audit: whether a memory write (
POST /v1/memory/memories), batch delete (DELETE), search retrieval (search/recall), or experience distillation (distillations) executed successfully, which async task ID it was associated with (jobId), and how many milliseconds it took?End-to-end call chain tracing (Trace): how much time and how many Tokens were consumed at each stage of an async write or hybrid retrieval — API acceptance, queue waiting, OceanBase vector query, and
dashscope-prodmodel calls (qwen-plus/text-embedding-v3/qwen3.7-text-rerank)?
In the reference project 企业智能客服与知识中台 (enterprise-ai-hub-210) on Agentbase 企业智能中台 (69c6d1aa00062e6bb60), request auditing (policy.requestAuditEnabled: true) is enabled by default. The shared X-AppBase-Trace-Id response header and APPBASE_TRACE_TAGS.capabilityMemory (the capability:memory tag) connect Memory pages with Observability / AgentOps.
Core Concepts and Architecture
Agentbase Memory's audit and observability architecture consists of three complementary layers: control-plane configuration version history, data-plane business request auditing (memory_events), and OpenTelemetry / Langfuse distributed tracing (Traces).
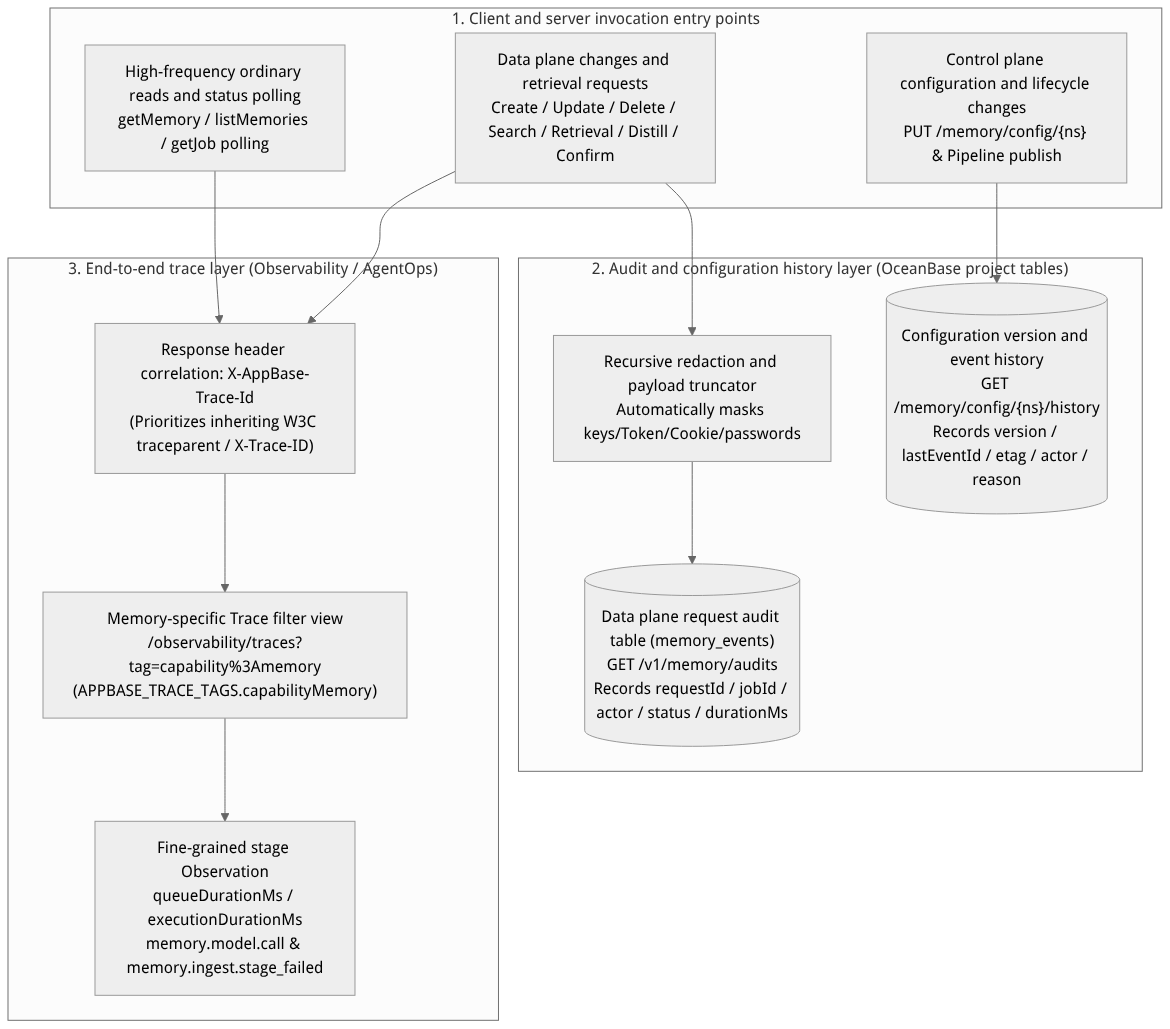
Flow diagram, not a runtime screenshot; read the relationships between steps or states along the arrows.
View the flow diagram in full size
Comparison of responsibilities and boundaries of the three types of observability data
| Observability dimension | Query entry / interface | Recorded scope and core fields | Content not recorded and design boundaries |
|---|---|---|---|
| Configuration change history (Config History) | Configuration → Config Versions or GET /v1/projects/{projectId}/memory/config/{namespace}/history | Records the version number (version), event ID (lastEventId), etag, operator (actor), change reason (reason), and before/after Diff for every config save and rollback. | Does not record unsaved page form inputs or sample trial-run raw text. |
| Business request audit (Request Audit) | Memory → Audit or GET /v1/memory/audits | Records memory creation, update, single/batch delete, search, unified retrieval, feedback/observation, import/export submissions, profile extraction, and context/knowledge governance operations; includes requestId, jobId, userId, HTTP status code, and elapsed time. | Does not record ordinary single-item reads (getMemory), list browsing (listMemories), statistics queries, or async task status polling (getJob) one by one, to prevent polling storms from drowning out critical business change audits. |
| Memory Trace | Memory → Trace (jumps to Agent Ops → Tracing, with tag=capability:memory) | Records API acceptance, background queue waiting, staged execution (fact extraction, vectorization, conflict detection, Rerank), model Token consumption and gateway error codes (gatewayStatus, errorCode). | Controlled by the platform-wide switch agentops.enabled and sampling rate (policy.observability.successSampleRate); not being sampled does not mean the business request was not executed. |
Feature Entrypoints and Permission Matrix
Console entry points and permission matrix
The Console entry point is located at: Project enterprise-ai-hub-210 → Memory (Memory) → Audit tab, and the adjacent Trace tab on its right.
| Function action | Console entry | REST API endpoint / route | Required permission Scope |
|---|---|---|---|
| Query the business request audit list | Memory → Audit tab search bar | GET /v1/memory/audits | memories.read |
| Toggle project request auditing | Memory → Configuration → Basic Configuration | PUT /v1/projects/{projectId}/memory/config/policy (requestAuditEnabled) | projects.write |
| View configuration change history and ETag | Memory → Configuration → Expand Config Versions | GET /v1/projects/{projectId}/memory/config/{namespace}/history | projects.read |
| One-click jump to view Memory Trace | Memory → Trace tab button | Route jump: /console/project-{region}-{project}/observability/traces?tag=capability%3Amemory | observability.traces.read |
Request-level Trace ID propagation and correlation mechanism
X-AppBase-Trace-Idresponse header: All successful responses passing through the Agentbase/v1/memory/*facade (HTTP 2xx) returnX-AppBase-Trace-Idin the HTTP response header (a 32-character non-all-zero lowercase hexadecimal correlation ID). The server first adopts a valid W3Ctraceparentrequest header passed by the caller, then a validX-Trace-ID; if neither is provided, a new ID is generated automatically.APPBASE_TRACE_TAGS.capabilityMemorytag routing: When you click the Memory → Trace tab in the Console, the frontend uses theAPPBASE_TRACE_TAGS.capabilityMemoryconstant (value"capability:memory") to automatically jump to the observability trace list and apply tag filtering, precisely filtering out all synchronous and asynchronous traces generated by the managed Memory service for the current project.Content capture dual gate (
captureContent): Whether Memory Trace records raw memory text and prompt content in Spans is subject to the dual constraints of the platform-global switchagentops.memoryCaptureContentEnabled(defaulttrue) and the project-level configurationpolicy.observability.captureContent. Content is only captured when both are enabled; otherwise sensitive payloads are displayed as[REDACTED].
Feature Details and Operation Guide
1. Verify write, retrieval, and deletion results with "Request Audit" in the Console
Log in to the Agentbase Console, enter the project
企业智能客服与知识中台(enterprise-ai-hub-210), and open the Memory (Memory) → Audit tab.Enter filter conditions in the top filter bar:
You can search by Request ID (
requestId), Target User ID (userId, e.g.user_zhangwei_001), Resource ID (e.g.memoryId), or Operation Name (operation);If investigating a specific asynchronous intelligent write, import/export, or distillation task, you can enter the exact
jobIdin the task filter box;Quick filtering by result status (success / failure) is supported.
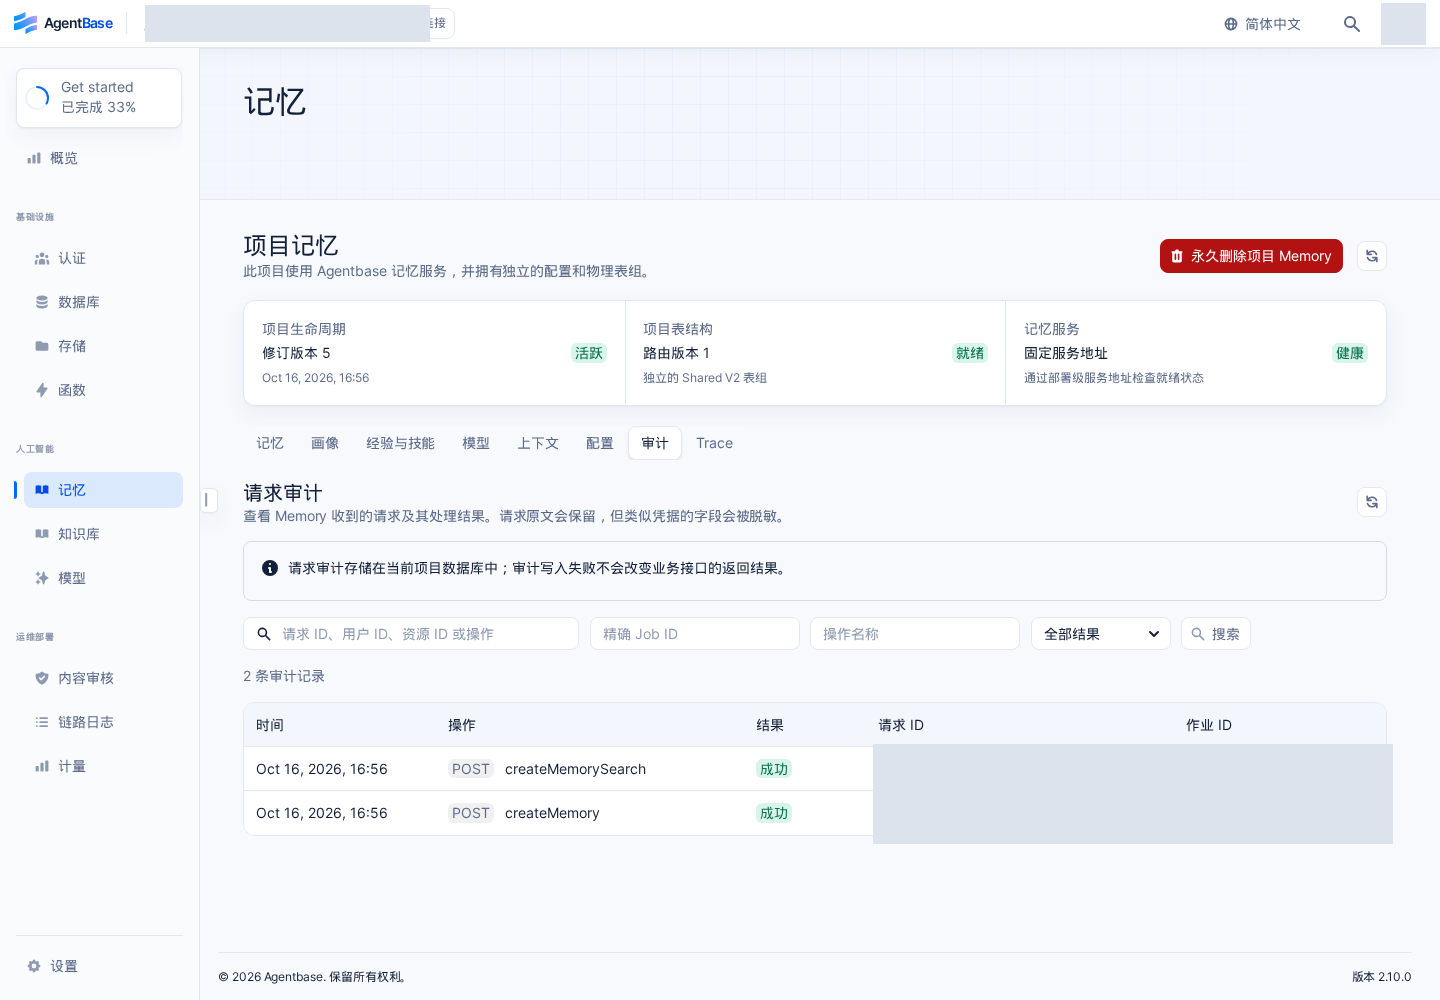
Interface reference: reuses previously registered historical screenshots; demo data may differ from the current project; no new screenshots were taken this time.
Click to expand the target audit record and verify the following key troubleshooting information:
Request metadata: HTTP method, request path, HTTP status code, operation principal (
actor), target user (userId), and associated resource ID;Sanitized request payload: the system automatically and recursively sanitizes credential fields in request parameters such as API Keys, Tokens, passwords, and Cookies, and safely truncates oversized bodies (do not proactively write business secrets into
metadatarelying on post-hoc sanitization);Async task terminal state and three-stage elapsed time: for async write tasks, cross-check
GET /v1/memory/jobs/{jobId}to compare queueing time (queueDurationMs), actual execution time (executionDurationMs), and end-to-end total time (totalDurationMs), distinguishing "API accepted and enqueued (HTTP 202)" from "background model finally completed execution (completed/partial_failed/failed)".
2. Audit and configuration history API parameters explained with call examples
(1) Query business request audit (GET /v1/memory/audits)
| Query parameter / response field | Type | Description and usage constraints |
|---|---|---|
limit (query parameter) | integer | Number of items returned per page, value 1~100 (default 25). |
cursor (query parameter) | string | Pagination cursor; pass back the nextCursor from the previous page's response as-is. |
jobId (query parameter) | string | Precisely filter associated audit records by a specific asynchronous task ID. |
userId / operation | string | Filter by target business user ID (e.g. user_zhangwei_001) or operation type. |
audits (response field) | array | List of matched audit events, stored in the project-specific memory_events table, subject to the retention.auditEventDays retention period. |
scanned / truncated | integer / bool | Number of underlying events scanned by this query and whether the scan limit truncation was triggered. |
export APPBASE_ENDPOINT="https://appbuild.oceanbase.com/v1"
export APPBASE_PROJECT_ID="enterprise-ai-hub-210"
export APPBASE_API_KEY="<APPBASE_API_KEY>"

# 1. Query recent memory writes and retrieval audit logs for user_zhangwei_001
curl -fsS --get "${APPBASE_ENDPOINT}/memory/audits" \
  -H "X-Appwrite-Project: ${APPBASE_PROJECT_ID}" \
  -H "X-Appwrite-Key: ${APPBASE_API_KEY}" \
  --data-urlencode "userId=user_zhangwei_001" \
  --data-urlencode "limit=20" | jq .

# 2. Verify audit results precisely by the jobId of the async write task
curl -fsS --get "${APPBASE_ENDPOINT}/memory/audits" \
  -H "X-Appwrite-Project: ${APPBASE_PROJECT_ID}" \
  -H "X-Appwrite-Key: ${APPBASE_API_KEY}" \
  --data-urlencode "jobId=job_01hxyz9876543210" | jq .
(2) Review configuration change history (lastEventId, etag, actor, reason)
When you need to audit when and by whom a configuration item (such as policy, provider, or evolution) was modified, call the configuration history endpoint:
# Query the configuration change audit history of the policy namespace
curl -fsS "${APPBASE_ENDPOINT}/projects/${APPBASE_PROJECT_ID}/memory/config/policy/history" \
  -H "Cookie: ${APPBASE_CONSOLE_SESSION}" \
  -H "X-Appwrite-Project: ${APPBASE_PROJECT_ID}" \
  -H "X-Appwrite-Mode: admin" | jq .
The typical response structure contains complete governance metadata for each change:
{
  "component": "memory",
  "scopeType": "project",
  "namespace": "policy",
  "currentVersion": 3,
  "lastEventId": "cfg_evt_01j9k2m4n6p8q0r2",
  "etag": "\"v3-8f9e1d2c3b4a\"",
  "items": [
    {
      "version": 3,
      "eventId": "cfg_evt_01j9k2m4n6p8q0r2",
      "etag": "\"v3-8f9e1d2c3b4a\"",
      "actor": "admin:69c6d1aa00062e6bb60",
      "reason": "开启搜索重排 rerankEnabled 并设置慢查询追踪阈值 slowThresholdMs=800",
      "createdAt": "2026-10-22T09:30:00.000Z"
    }
  ]
}
3. Jump from Memory to Trace to locate slow requests and model call anomalies
When you find in the Audit tab that a request took unusually long or an async task shows retries, click the Memory → Trace tab to enter the observability trace view (auto-filtered by tag=capability:memory):
Verify the time window and associated IDs: enter the
X-AppBase-Trace-Idreturned in the response header into the trace list search box (if_APP_OBSERVABILITY_YUNTU_TRACE_LINK_ENABLED=enabledis enabled in the Jiuzhou Yuntu environment, you can also directly search theSOFA-TraceIdcorresponding tometadata.cloudAtlasTraceId).Analyze the stage waterfall (Timeline) and model calls:
For async intelligent writing (
infer=true): multiple retries of the samejobIdreuse the same root Trace ID, and eachattemptgenerates an independent child Span; expanding thememory.model.callnode lets you view the precise time and Prompt/Completion Token consumption of calls toqwen-plusortext-embedding-v3;For stage failure diagnosis: if a stage fails, the
memory.ingest.stage_failedevent directly recordserrorClass,errorCode(e.g.LLM_RATE_LIMITED,LLM_TIMEOUT,LLM_INVALID_JSON),retryable, andgatewayStatus, enabling root cause identification without logging into servers to dig through container logs;For online memory retrieval (
search): if the project has neither profile rewriting (profileRewriteEnabled=false) nor reranking (rerankEnabled=false) enabled, the retrieval chain only contains Embedding vectorization and OceanBase deterministic retrieval Spans, with no Chat Generation node — this is a normal high-performance deterministic retrieval path.
FAQ (Frequently Asked Questions and Troubleshooting)
1. Why can't I find the corresponding record in the "Audit" tab after calling GET /v1/memory/memories to query the list or polling GET /v1/memory/jobs/{jobId}?
Root cause: By design, the Memory request audit (
memory_events) is dedicated to recording business data changes, retrieval recall, and key governance decisions. Plain single-record reads (getMemory), list browsing (listMemories), statistics/timeline reads, queries against the audit list itself, and asynchronous task status polling do not write business request audits, to prevent high-frequency polling from flooding storage and obscuring records of genuine write operations.Solution: To troubleshoot the latency or status of ordinary read requests, use the
X-AppBase-Trace-Idin the response headers to go to Agent Operations → Traces and view the distributed tracing records.
2. If an audit record is missing or a successful memory operation cannot be found in the Trace list, does that mean the operation did not take effect?
Root cause: You cannot assert that a business operation did not occur based solely on missing audit records or Traces. There are two reasons: ① Audit writing uses a non-blocking design; even if the audit record fails to persist in extreme cases, the already successfully committed memory business transaction is never rolled back or rewritten; ② Trace export is governed by the platform-wide observability master switch (
agentops.enabled), the project observability switch (policy.observability.enabled), and the successful-request sampling rate (policy.observability.successSampleRate); requests that miss the sample or encounters congestion in the asynchronous delivery queue do not generate Traces.Solution: To determine whether a given memory or asynchronous task actually took effect, always rely on the final task-state receipt from
GET /v1/memory/jobs/{jobId}and the actual data query results fromGET /v1/memory/memories.
3. How to make the “Metrics analysis” in Agent Operations only count model Tokens and latency produced by the Memory pipeline?
Root cause: When a project runs Agent Runtime, the knowledge base, and Memory simultaneously, the default metrics dashboard aggregates all traces across the entire project.
Solution: Go to the Agent Operations (Observability) → Metrics or Traces page and enable the Memory only (
memoryOnly) filter toggle (or filter by the tagcapability:memory) to separately aggregate and analyze the call latency, Token consumption, and evaluation scores of the Memory pipeline. See Metrics Monitoring and Analysis Reports.