
Metrics Monitoring and Analytical Reports
Feature Overview
Metrics & Analytical Reports (Console entry: Agent Ops → Metrics; report visibility depends on deployment configuration) are Agentbase's production operations measurement and ROI decision dashboards for technical leads, AI architects, and operations teams. After an LLM application is deployed at scale, teams need real-time visibility into system throughput and financial health to answer three core questions: "How many tokens and how much cost were spent?", "How fast are first-token latency (TTFT) and end-to-end latency (P50/P95/P99)?", and "What is the answer quality of each agent and the distribution of Bad Case attribution?"
In the example project 企业智能客服与知识中台 (enterprise-ai-hub-210) under Agentbase 企业智能中台 (69c6d1aa00062e6bb60), the system derives full-dimension metrics and three thematic analytical reports (/v1/observability/reports/{overview|agents|quality}) in real time from the collected Traces, Observations, and Scores:
Trace-derived metrics (Metrics): review available call counts, token usage, latency, and costs; the Observations view supports the
memoryOnlyfilter for Memory-related observations. Available metrics depend on collection and deployment configuration;Three advanced analytical reports (Reports,
v2.10.0): through the Overview, Agents (agent rankings and ROI), and Quality (quality grading and Bad Case attribution) tabs, providing snapshots and period-over-period deltas for the last 24 hours / 7 days / 30 days and custom windows (≤30 days), supporting deep analysis of optimization opportunities bywasteReason(token waste reasons),cache.status(cache hits), andbadCaseCategory(bad case attribution).
Core Concepts and Architecture
Agentbase's metrics and reporting engine is built directly on the underlying analytical trace and score storage, using server-side Bundle merge queries and a two-stage Top-N time-series aggregation architecture, so a single page renders multi-dimensional metrics with just one HTTP request.
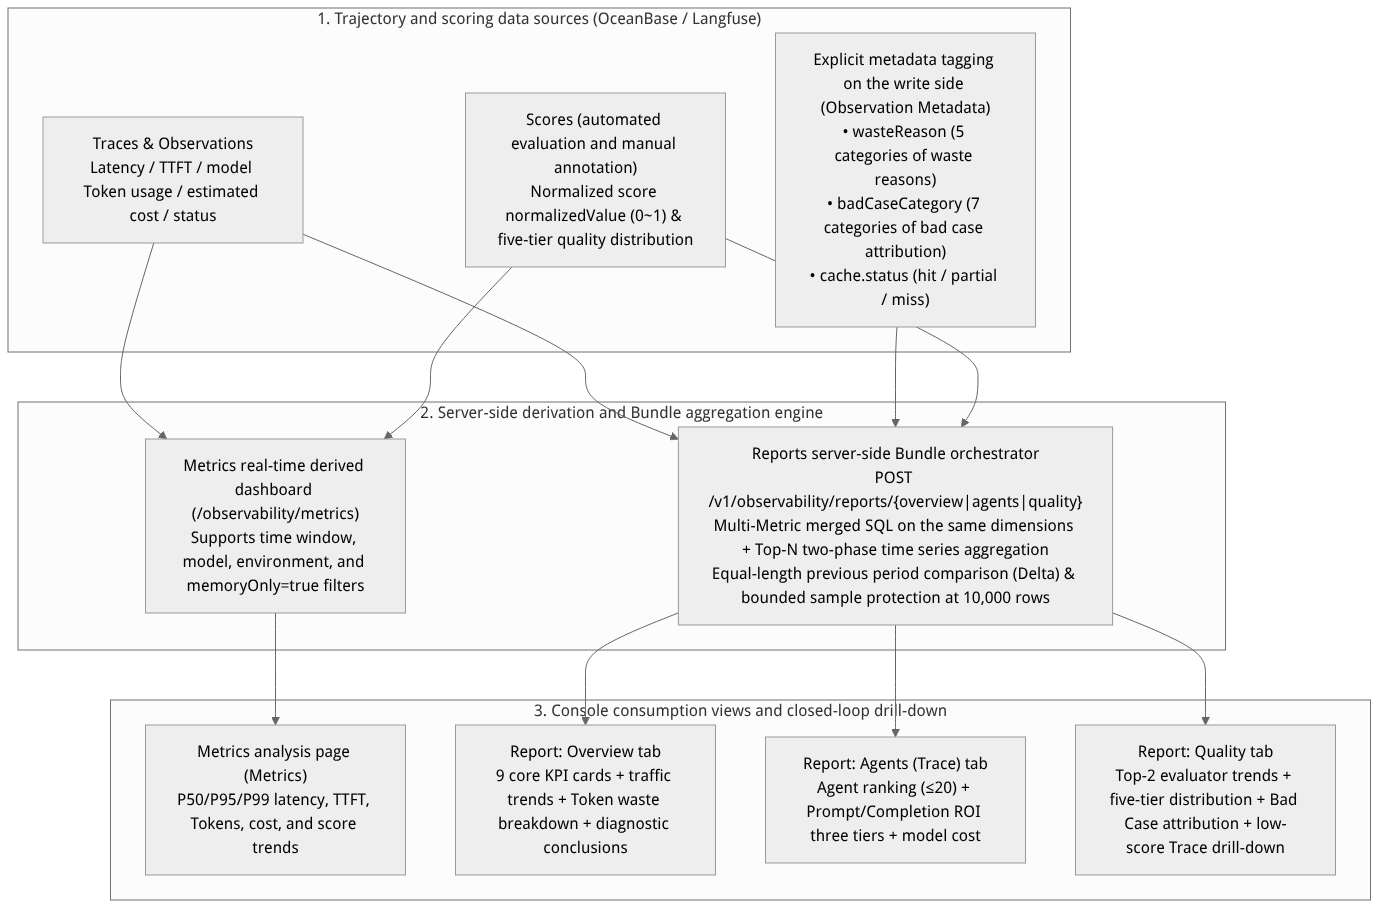
Flow diagram, not a runtime screenshot; read the relationships between steps or states along the arrows.
View the flow diagram in full size
Core Metrics and Calculation Rules Table
| Metric category | Metric name | Calculation rules and statistics |
|---|---|---|
| Throughput and activity | Total Traces / Total Observations / Active users | Deduplicated counts within the selected time window of end-to-end requests, internal nodes, and non-empty userId (e.g., user_zhangwei_001). |
| Token consumption | Input (Prompt) / Output (Completion) / Total Tokens | Aggregates real vendor-reported tokens from all GENERATION and EMBEDDING nodes. cached (cache-hit tokens) and reasoning (reasoning chain tokens) map to mutually exclusive sub-buckets and are not double-counted into total billable tokens; calls directly short-circuited by the cache are recorded as avoided call (with 0 new consumption). |
| Latency percentiles | End-to-end latency and TTFT (P50 / P95 / P99) | - End-to-end latency: the 50th, 95th, and 99th percentile values within the window of the total duration of a Trace or Generation from startTime to endTime; - First-token latency (TTFT, Time To First Token): the duration percentiles of streaming LLM calls from request initiation to receiving the first generated token ( completionStartTime). |
| Cost estimation | Total model cost estimate / Cost per Session | Estimated amounts computed from the model unit price table matched by each GENERATION node (e.g., qwen-plus, qwen-vl-max) (for directional R&D and operations reference only; actual financial settlement is governed by the platform's quotas and metering bills). |
| Error rate and quality | Error rate / Overall quality score / Evaluation coverage | - Error rate: the proportion of Traces/Observations with status ERROR (the gateway layer strictly distinguishes 5xx server-side failures, 429 rate limiting, and ordinary 4xx business rejections, and does not mix ordinary 4xx responses into the service failure rate); - Overall quality score: the arithmetic mean (rounded to two decimal places) of all normalizable numeric scores ( normalizedValue) within the window; - Evaluation coverage: the percentage of Traces linked to at least one evaluation Score out of the total number of Traces. |
Roles, Entry Points, and Relationships
Console Entry and REST API Permission Matrix
Metrics monitoring page (Metrics): located in the left navigation under Agent Ops (Observability / AgentOps) → Metrics (route:
/console/project-{region}-enterprise-ai-hub-210/observability/metrics).Analytical reports page (Reports): the entry and page depend on deployment visibility settings. When reports are hidden, direct links also redirect; check deployment configuration and permissions if access is needed.
| API / page | HTTP method and path | Required API Key scopes (included by default in user sessions/JWT roles) |
|---|---|---|
| Metrics query | /v1/observability/metrics (and Console aggregate query) | observability.metrics.read |
| Overview global report | POST /v1/observability/reports/overview | observability.metrics.read |
| Agents agent ranking report | POST /v1/observability/reports/agents | observability.metrics.read + observability.traces.read + observability.users.read + observability.sessions.read |
| Quality and attribution report | POST /v1/observability/reports/quality | observability.metrics.read + observability.traces.read + observability.scores.read |
Feature Details and Operation Guide
1. View the Metrics page and the memoryOnly-exclusive filter
Log in to the Agentbase Console, go to project
企业智能客服与知识中台(enterprise-ai-hub-210), and click AgentOps → Metrics in the left sidebar.
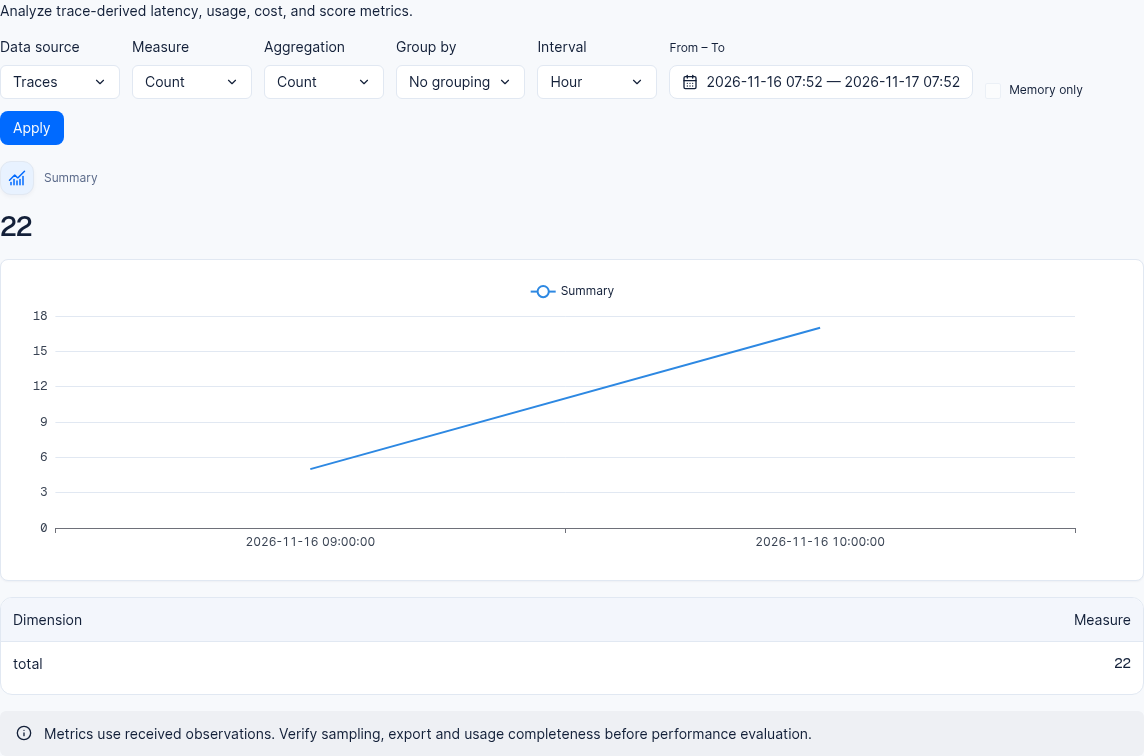
Figure: Metrics page in a 2.12.0 test project; contents vary by project.
Key filtering and analysis actions:
Time range and environment filter: select the statistics time period and target environment (e.g.,
production);memoryOnlyfilter: enable this option in the Observations view to add aservice=memoryfilter to the console query. Traces and Scores do not offer this filter; do not assume that scores have also been filtered by Memory;Break down usage and cost by model: in the model detail table, compare the call counts, Prompt/Completion Token proportions, and estimated costs of
qwen-plus,qwen-turbo,text-embedding-v3,qwen3.7-text-rerank, andqwen-vl-max.
2. Use the three analytical reports (/v1/observability/reports) for global insights and ROI
When the reports page is available, or when making an authorized POST /v1/observability/reports/{overview|agents|quality} request, queries share a unified time range contract:
Preset time window (
range): supports"24h"(last 24 hours),"7d"(last 7 days, default), and"30d"(last 30 days);Custom time window (
from+to): supports passing ISO-8601 start and end times as a pair; the maximum span must not exceed 30 calendar days (30 × 24h), andfrom < tomust be satisfied (invalid windows directly return 400 parameter error and do not silently degrade to empty data);Automatic equal-length period-over-period comparison (Delta): the system automatically computes the delta against the immediately preceding equal-length period (
previousFromtopreviousTo); when the span is≤ 24h, the trend chart aggregates by hour (hour), otherwise by day (day).
(1) Overview (global overview tab)
Top 9 core KPI cards (including period-over-period Delta):
Traces 总数,活跃用户数,Tokens 总量,成本(估算),P95 延迟,错误率,综合质量分,评测覆盖率,单会话成本.Trend and breakdown panels:
Traffic trend: time-series line chart of Trace counts, grouped by the top five agents ranked by call volume;
Dual-axis latency and quality trend: the left axis shows P95 latency (ms), and the right axis shows the overall quality score (
0~1) for comparison;Token waste breakdown (by
wasteReason), Top 5 Agents / Top 5 Models, normalized five-tier quality distribution (Excellent / Good / Average / Poor / Very Poor);Natural-language diagnostic conclusions: the rule engine automatically generates readable diagnostic hints based on thresholds (e.g., pointing out this week's retry waste proportion or P95 latency violations).
(2) Agents (agent ranking and ROI tab, displayed as Trace in the Console tab)
Agent ranking table (Top 20): lists the 20 agents with the highest call volume, showing call count, P95 latency, average quality score, low-score proportion, health status badges (
正常/预警/异常), and diagnostic hints (e.g.,Prompt 偏重,较慢). Clicking an agent name navigates directly to the Trace list with the filter applied.Prompt / Completion Token ROI three-tier analysis: based on the ratio of input Prompt Tokens to output Completion Tokens, agents are automatically classified into High ROI, Balanced, and Low ROI tiers, quickly identifying agents whose system prompts or retrieval context injection are too heavy while effective output is extremely short.
Step (tool call) and model cost details, Top active users / sessions / recent Trace list (the recent Trace list comes with each trace's actual
latencyMsandobservationCountin real time).
(3) Quality (quality trend and bad case attribution tab)
Quality KPI and Top-2 evaluator trends: shows the overall quality score, average score trends of the two most frequently hit evaluators (Top 2 Evaluators), and P95 latency.
Bad case attribution panel (by
badCaseCategory), low-score Trace list (in thepoor/very-poortier, with one-click drill-down to details), and evaluator coverage comparison.10,000 row-bounded sample protection mechanism: To guarantee query responsiveness for high-traffic projects, the Quality low-score list and the Agents recent Trace list read at most the latest 10,000 rows in reverse chronological order within the same window. When the candidate scores within the window exceed 10,000 records, the API returns
lowScoresLimited: true,insightsLimited: true, andfacetsLimited: true(Overview correspondingly returnsscoreInsightsLimited: true), and the Console automatically shows the “results are a bounded sample” notice and hides the cross-caliber comparison between the sample's current average score and the previous period's whole-window average, guiding users to narrow the time window to view the complete full dataset.
3. Write-side explicit metadata tagging specification (wasteReason, badCaseCategory, cache)
The Token waste breakdown, cache hit rate, and bad case attribution panels in the reports strictly aggregate based on fields explicitly tagged on the write side in Observation.metadata (untagged normal data is not mixed into the “unknown waste” bucket):
| Metadata field path | Allowed standard enum values | Enum semantics and improvement guidance |
|---|---|---|
metadata.wasteReason | retry, truncation, cache_miss_repeat, context_overflow, user_abort | Respectively identify invalid Token consumption caused by error-triggered retries, reruns after output-length truncation, identical-prefix cache misses, context-overlimit discards, and user mid-stream cancellation. A missing field indicates normal, valid consumption. |
metadata.badCaseCategory | grounding_missing, hallucination, instruction_violation, tool_failure, query_understanding, safety_refusal, latency_timeout | Seven mutually exclusive bad case attribution buckets: e.g., grounding_missing points to optimizing knowledge base retrieval, and tool_failure points to fixing tool schemas or downstream APIs. |
metadata.cache.status | hit, partial, miss | Cache status supplied by the caller; presence and meaning depend on the data source. |
4. Examples of calling the analytical report Bundle API
(
  set +x
  set -o pipefail
  : "${APPBASE_API_KEY:?Set APPBASE_API_KEY}"
  : "${APPBASE_ENDPOINT:?Set APPBASE_ENDPOINT to the target API endpoint including /v1}"
  APPBASE_ENDPOINT="${APPBASE_ENDPOINT%/}"
  : "${APPBASE_PROJECT_ID:?Set APPBASE_PROJECT_ID for the target environment}"
  : "${APPBASE_API_KEY:?Set APPBASE_API_KEY for the target environment}"

  # 1. Query the Overview global report for the last 7 days (7d)
  builtin printf 'X-Appwrite-Key: %s\n' "${APPBASE_API_KEY:?Set APPBASE_API_KEY}" | curl --disable --header @- -fsS -X POST "${APPBASE_ENDPOINT}/observability/reports/overview" \
    -H "X-Appwrite-Project: ${APPBASE_PROJECT_ID}" \
    -H "Content-Type: application/json" \
    --data '{
      "range": "7d"
    }' | jq .

  # 2. Query Quality and Bad Case attribution reports with a custom time window (from/to, span <= 30 days)
  builtin printf 'X-Appwrite-Key: %s\n' "${APPBASE_API_KEY:?Set APPBASE_API_KEY}" | curl --disable --header @- -fsS -X POST "${APPBASE_ENDPOINT}/observability/reports/quality" \
    -H "X-Appwrite-Project: ${APPBASE_PROJECT_ID}" \
    -H "Content-Type: application/json" \
    --data '{
      "from": "2026-10-01T00:00:00.000Z",
      "to": "2026-10-22T23:59:59.999Z"
    }' | jq .
)
Querying metrics
Open the metrics page via Observability / AgentOps → Metrics in the project sidebar.
Select the data view, metric, aggregation method, grouping dimension, time granularity, and start/end times, then click Apply. The default query covers the last 24 hours, with time granularity defaulting to Hour; available granularities are Minute, Hour, Day, and Week.
View the summary values, time-series charts, and dimension breakdown tables. After selecting a grouping, you can compare changes across dimensions; when you need to inspect a Trace's input/output or specific stages, return to the Trace to check details.
Available metrics and groupings depend on the data view:
| Data view | Metrics | Available groupings |
|---|---|---|
| Traces | Count, latency, Token usage, cost | No grouping, Trace name, Environment |
| Observations | Count, latency, Token usage, cost | No grouping, model, Trace name, Environment, stage, purpose, result, usage completeness |
| Scores | Count, score | No grouping, score name, Trace name, Environment |
Aggregation options adjust based on the selected metric: Count uses Count; latency supports Count, Average, P50, P95; Token usage and cost support Sum and Average; scores support Count and Average. Select the data view and metric first, then choose from the aggregation options provided on the page.
Memory only is available only in the Observations view and filters Memory-related Observations. Some Console versions also show the option disabled in the Traces and Scores views; this does not mean scores are filtered by Memory.
When there is no metric data
If the chart shows No metric data, first check whether the start/end times cover the period when the data was produced, then confirm whether the data view, metric, and grouping match; when using Memory only, also confirm that the query target is Observations. After changing the conditions, click Apply again. The page's refresh button re-issues the current metrics query.
If there is still no data after adjusting the conditions, verify that the current project has written Traces, Observations, or Scores of the corresponding type, and check the Trace's time and usage records. An empty result only means the current query returned no data; it cannot be used to conclude “no calls”, “zero cost”, or “zero quality”.
FAQ and Troubleshooting
1. Why do the Reports pages show data for total calls and Tokens, but the “Token waste” or “Bad case attribution” panels appear empty?
Cause analysis: This is not a report query failure.
Token 浪费,缓存命中, andBad Case 归因depend on the write side explicitly writing thewasteReason,cache.status, andbadCaseCategoryfields inObservation.metadata. If the current project's reporting pipeline has not injected these three metadata tags, the system will not force untagged normal calls into the “unclassified waste” bucket; instead, it displays an empty panel with a notice that tagging coverage has not been established.Resolution: Referring to the “write-side explicit metadata tagging specification” above, supplement the
metadata.wasteReason,metadata.cache, andmetadata.badCaseCategoryfields according to the specification when the application or gateway reportsgeneration-createevents; newly written data will enter the breakdown panels in real time.
2. Why does clicking “Apply” for a custom report time range fail or become disabled?
Cause analysis: Analytical Reports enforce three-layer consistent validation on custom time windows (
from/to) (Console frontend, PHP gateway, and the underlying analytics engine): ① the custom time span must not exceed 30 calendar days (30 × 24h); ② the start timefrommust be strictly earlier than the end timeto(equal start/end or reversed order is not allowed).Resolution: Keep each query's custom start/end time span within 30 days; to compare earlier historical periods, pull snapshots in multiple separate 30-day windows.
3. Do the model costs shown in Metrics and Reports exactly match the actual charges in the organization's bill?
Cause analysis: The cost figures in Metrics and Reports are real-time estimates derived from the model names and Token counts recorded at the
GENERATIONnode in Traces multiplied by reference unit prices, intended to help engineering teams intuitively compare the relative cost efficiency (ROI) of different agents or model choices. Actual billing is also affected by upstream vendor tiered discounts, monthly resource package deductions, or unsampled Traces.Resolution: Treat costs in the observability dashboards as a reference for engineering optimization and ROI evaluation; for financial reconciliation and quota verification, go to the project's Limits, quotas, and usage metering page to view the authoritative metering aggregates.