
Memory Audit Logs and Trace Localization
Feature overview and core scenarios
Memory Audit & Trace (accessed through the audit tab and trace entry) is the core observability system for enterprise security and compliance, change tracking, and production performance troubleshooting in Agentbase Memory. In multi-team environments with frequent agent interactions, operations and architecture teams need clear answers to three types of questions:
Configuration change history tracing: who modified which Memory configuration namespace or Pipeline, when, and for what reason (
reason), and what are the correspondinglastEventIdandETag?Business data-plane operation audit: whether a memory write (
POST /v1/memory/memories), batch delete (DELETE), search retrieval (search/recall), or experience distillation (distillations) executed successfully, which async task ID it was associated with (jobId), and how many milliseconds it took?End-to-end call chain tracing (Trace): how much time and how many Tokens were consumed at each stage of an async write or hybrid retrieval — API acceptance, queue waiting, OceanBase vector query, and
dashscope-prodmodel calls (qwen-plus/text-embedding-v3/qwen3.7-text-rerank)?
In the reference project 企业智能客服与知识中台 (enterprise-ai-hub-210) on Agentbase 企业智能中台 (69c6d1aa00062e6bb60), request auditing (policy.requestAuditEnabled: true) is enabled by default. The X-AppBase-Trace-Id response header links memory operations to traces in Observability / AgentOps.
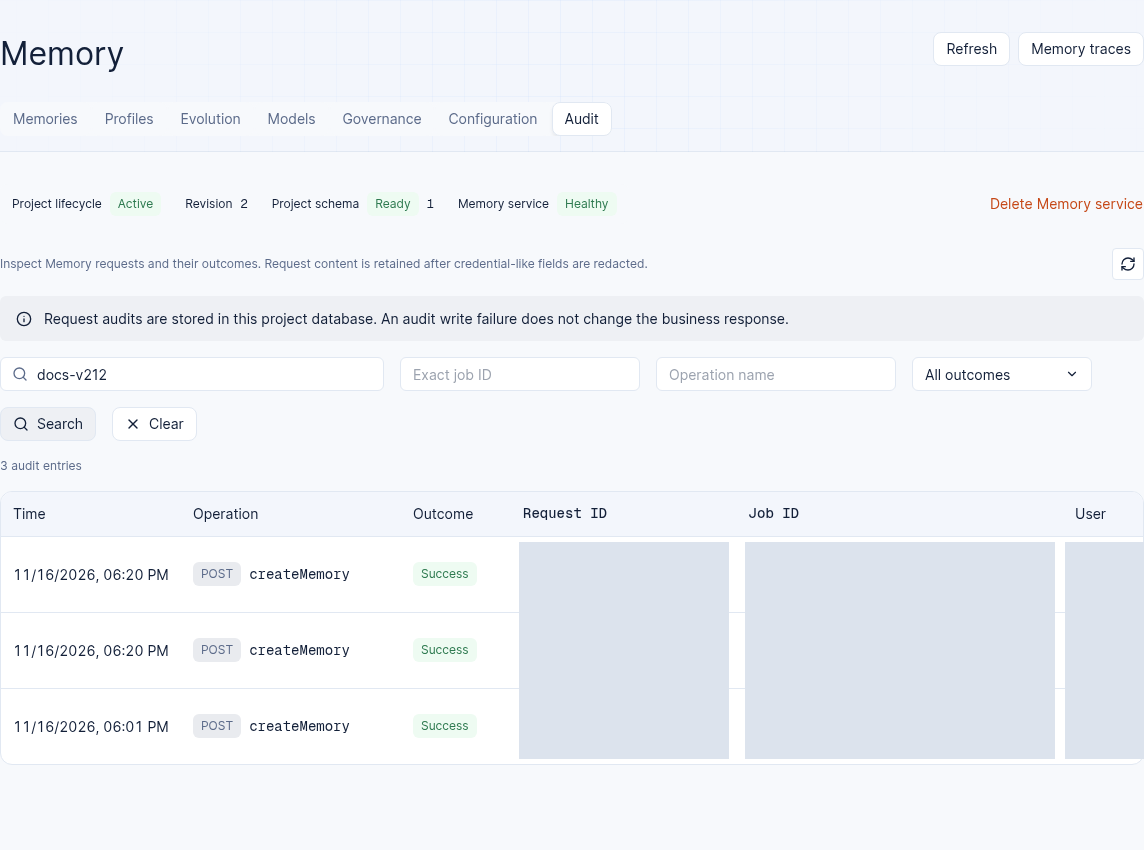
The test-project audit entries have request, job, and user identifiers masked.
Core Concepts and Architecture
Agentbase Memory's audit and observability architecture consists of three complementary layers: control-plane configuration version history, data-plane business request auditing (memory_events), and OpenTelemetry / Langfuse distributed tracing (Traces).
Comparison of responsibilities and boundaries of the three types of observability data
| Observability dimension | Query entry / interface | Recorded scope and core fields | Content not recorded and design boundaries |
|---|---|---|---|
| Configuration change history (Config History) | Configuration → Config Versions or GET /v1/projects/{projectId}/memory/config/{namespace}/history | Records the version number (version), event ID (lastEventId), etag, operator (actor), change reason (reason), and before/after Diff for every config save and rollback. | Does not record unsaved page form inputs or sample trial-run raw text. |
| Business request audit (Request Audit) | Memory → Audit or GET /v1/memory/audits | Records memory creation, update, single/batch delete, search, unified retrieval, feedback/observation, import/export submissions, profile extraction, and context/knowledge governance operations; includes requestId, jobId, userId, HTTP status code, and elapsed time. | Does not record ordinary single-item reads (getMemory), list browsing (listMemories), statistics queries, or async task status polling (getJob) one by one, to prevent polling storms from drowning out critical business change audits. |
| Memory Trace | Memory traces button (opens Agent Ops → Tracing, with tag=memory) | Records API acceptance, background queue waiting, staged execution (fact extraction, vectorization, conflict detection, Rerank), model Token consumption and gateway error codes (gatewayStatus, errorCode). | Controlled by the platform-wide switch agentops.enabled and sampling rate (policy.observability.successSampleRate); not being sampled does not mean the business request was not executed. |
Feature Entrypoints and Permission Matrix
Console entry points and permission matrix
In project enterprise-ai-hub-210, open the Memory → Audit tab. Use the separate Memory traces button to open tracing.
| Function action | Console entry | REST API endpoint / route | Required permission Scope |
|---|---|---|---|
| Query the business request audit list | Memory → Audit tab search bar | GET /v1/memory/audits | A privileged Console session, or the current project API key with memories.read; ordinary end users cannot query project audits |
| Toggle project request auditing | Memory → Configuration → Basic Configuration | PUT /v1/projects/{projectId}/memory/config/policy (requestAuditEnabled) | projects.write |
| View configuration change history and ETag | Memory → Configuration → Expand Config Versions | GET /v1/projects/{projectId}/memory/config/{namespace}/history | projects.read |
| Open Memory Trace | Memory traces button | Route to the project trace page; initial filter is tag=memory | observability.traces.read |
Request-level Trace ID propagation and correlation mechanism
X-AppBase-Trace-Idresponse header: All successful responses passing through the Agentbase/v1/memory/*facade (HTTP 2xx) returnX-AppBase-Trace-Idin the HTTP response header (a 32-character non-all-zero lowercase hexadecimal correlation ID). The server first adopts a valid W3Ctraceparentrequest header passed by the caller, then a validX-Trace-ID; if neither is provided, a new ID is generated automatically.Trace tag filtering: Opening tracing from the Memory page navigates to the observability trace list. The initial filter is
tag=memory; adjust it on the trace page as needed.Content capture dual gate (
captureContent): Memory content capture depends on platformagentops.memoryCaptureContentEnabledand projectpolicy.observability.captureContent. Ordinary diagnostic Generations omit model input/output; a separate evaluation Trace may contain raw content when capture is enabled. Sanitize before reporting and do not assume automatic replacement with[REDACTED].
Feature Details and Operation Guide
1. Verify write, retrieval, and deletion results with "Request Audit" in the Console
Log in to the Agentbase Console, enter the project
企业智能客服与知识中台(enterprise-ai-hub-210), and open the Memory (Memory) → Audit tab.Enter filter conditions in the top filter bar:
You can search by Request ID (
requestId), Target User ID (userId, e.g.user_zhangwei_001), Resource ID (e.g.memoryId), or Operation Name (operation);If investigating a specific asynchronous intelligent write, import/export, or distillation task, you can enter the exact
jobIdin the task filter box;Quick filtering by result status (success / failure) is supported.
Click to expand the target audit record and verify the following key troubleshooting information:
Request metadata: HTTP method, request path, HTTP status code, operation principal (
actor), target user (userId), and associated resource ID;Request audit payload: audit processing recursively handles recognizable credential key names and truncates oversized values; it cannot identify all sensitive content in arbitrary text. Do not put secrets or unsanitized business data in
metadataor request bodies.Async task terminal state and three-stage elapsed time: for async write tasks, cross-check
GET /v1/memory/jobs/{jobId}to compare queueing time (queueDurationMs), actual execution time (executionDurationMs), and end-to-end total time (totalDurationMs), distinguishing "API accepted and enqueued (HTTP 202)" from "background model finally completed execution (completed/partial_failed/failed)".
2. Audit and configuration history API parameters explained with call examples
(1) Query business request audit (GET /v1/memory/audits)
| Query parameter / response field | Type | Description and usage constraints |
|---|---|---|
limit (query parameter) | integer | Number of items returned per page, value 1~100 (default 25). |
cursor (query parameter) | string | Pagination cursor; pass back the nextCursor from the previous page's response as-is. |
jobId (query parameter) | string | Precisely filter associated audit records by a specific asynchronous task ID. |
userId / operation | string | Filter by target business user ID (e.g. user_zhangwei_001) or operation type. |
audits (response field) | array | List of matched audit events, stored in the project-specific memory_events table, subject to the retention.auditEventDays retention period. |
scanned / truncated | integer / bool | Number of underlying events scanned by this query and whether the scan limit truncation was triggered. |
(
  set +x
  set -o pipefail
  : "${APPBASE_API_KEY:?Set APPBASE_API_KEY}"
  : "${APPBASE_ENDPOINT:?Set APPBASE_ENDPOINT to the target API endpoint including /v1}"
  APPBASE_ENDPOINT="${APPBASE_ENDPOINT%/}"
  : "${APPBASE_PROJECT_ID:?Set APPBASE_PROJECT_ID for the target environment}"
  : "${APPBASE_API_KEY:?Set APPBASE_API_KEY for the target environment}"

  # 1. Query recent memory writes and retrieval audit logs for user_zhangwei_001
  builtin printf 'X-Appwrite-Key: %s\n' "${APPBASE_API_KEY:?Set APPBASE_API_KEY}" | curl --disable --header @- -fsS --get "${APPBASE_ENDPOINT}/memory/audits" \
    -H "X-Appwrite-Project: ${APPBASE_PROJECT_ID}" \
    --data-urlencode "userId=user_zhangwei_001" \
    --data-urlencode "limit=20" | jq .

  # 2. Verify audit results precisely by the jobId of the async write task
  builtin printf 'X-Appwrite-Key: %s\n' "${APPBASE_API_KEY:?Set APPBASE_API_KEY}" | curl --disable --header @- -fsS --get "${APPBASE_ENDPOINT}/memory/audits" \
    -H "X-Appwrite-Project: ${APPBASE_PROJECT_ID}" \
    --data-urlencode "jobId=job_01hxyz9876543210" | jq .
)
(2) Review configuration change history (lastEventId, etag, actor, reason)
When you need to audit when and by whom a configuration item (such as policy, provider, or evolution) was modified, call the configuration history endpoint:
(
  set +x
  set -e -o pipefail
  : "${APPBASE_CONSOLE_SESSION:?Set APPBASE_CONSOLE_SESSION}"
# Query the configuration change audit history of the policy namespace
builtin printf 'Cookie: %s\n' "$APPBASE_CONSOLE_SESSION" | curl --disable --header @- -fsS "${APPBASE_ENDPOINT}/projects/${APPBASE_PROJECT_ID}/memory/config/policy/history" \
  -H "X-Appwrite-Project: ${APPBASE_PROJECT_ID}" \
  -H "X-Appwrite-Mode: admin" | jq .
)
The typical response structure contains complete governance metadata for each change:
{
  "component": "memory",
  "scopeType": "project",
  "namespace": "policy",
  "currentVersion": 3,
  "lastEventId": "cfg_evt_01j9k2m4n6p8q0r2",
  "etag": "\"v3-8f9e1d2c3b4a\"",
  "items": [
    {
      "version": 3,
      "eventId": "cfg_evt_01j9k2m4n6p8q0r2",
      "etag": "\"v3-8f9e1d2c3b4a\"",
      "actor": "admin:69c6d1aa00062e6bb60",
      "reason": "开启搜索重排 rerankEnabled 并设置慢查询追踪阈值 slowThresholdMs=800",
      "createdAt": "2026-10-22T09:30:00.000Z"
    }
  ]
}
3. Jump from Memory to Trace to locate slow requests and model call anomalies
When you find in the Audit tab that a request took unusually long or an async task shows retries, use the Memory traces button to open the trace view (the initial filter is tag=memory):
Verify the time window and associated IDs: enter the
X-AppBase-Trace-Idreturned in the response header into the trace list search box (if_APP_OBSERVABILITY_YUNTU_TRACE_LINK_ENABLED=enabledis enabled in the Jiuzhou Yuntu environment, you can also directly search theSOFA-TraceIdcorresponding tometadata.cloudAtlasTraceId).Analyze the stage waterfall (Timeline) and model calls:
For async intelligent writing (
infer=true): multiple retries of the samejobIdreuse the same root Trace ID, and eachattemptgenerates an independent child Span; expanding thememory.model.callnode lets you view the precise time and Prompt/Completion Token consumption of calls toqwen-plusortext-embedding-v3;For stage failure diagnosis: if a stage fails, the
memory.ingest.stage_failedevent directly recordserrorClass,errorCode(e.g.LLM_RATE_LIMITED,LLM_TIMEOUT,LLM_INVALID_JSON),retryable, andgatewayStatus, enabling root cause identification without logging into servers to dig through container logs;For online memory retrieval (
search): if the project has neither profile rewriting (profileRewriteEnabled=false) nor reranking (rerankEnabled=false) enabled, the retrieval chain only contains Embedding vectorization and OceanBase deterministic retrieval Spans, with no Chat Generation node — this is a normal high-performance deterministic retrieval path.
FAQ (Frequently Asked Questions and Troubleshooting)
1. Why can't I find the corresponding record in the "Audit" tab after calling GET /v1/memory/memories to query the list or polling GET /v1/memory/jobs/{jobId}?
Root cause: By design, the Memory request audit (
memory_events) is dedicated to recording business data changes, retrieval recall, and key governance decisions. Plain single-record reads (getMemory), list browsing (listMemories), statistics/timeline reads, queries against the audit list itself, and asynchronous task status polling do not write business request audits, to prevent high-frequency polling from flooding storage and obscuring records of genuine write operations.Solution: To troubleshoot the latency or status of ordinary read requests, use the
X-AppBase-Trace-Idin the response headers to go to Agent Operations → Traces and view the distributed tracing records.
2. If an audit record is missing or a successful memory operation cannot be found in the Trace list, does that mean the operation did not take effect?
Root cause: You cannot assert that a business operation did not occur based solely on missing audit records or Traces. There are two reasons: ① Audit writing uses a non-blocking design; even if the audit record fails to persist in extreme cases, the already successfully committed memory business transaction is never rolled back or rewritten; ② Trace export is governed by the platform-wide observability master switch (
agentops.enabled), the project observability switch (policy.observability.enabled), and the successful-request sampling rate (policy.observability.successSampleRate); requests that miss the sample or encounters congestion in the asynchronous delivery queue do not generate Traces.Solution: To determine whether a given memory or asynchronous task actually took effect, always rely on the final task-state receipt from
GET /v1/memory/jobs/{jobId}and the actual data query results fromGET /v1/memory/memories.
3. How to make the “Metrics analysis” in Agent Operations only count model Tokens and latency produced by the Memory pipeline?
Root cause: When a project runs Agent Runtime, the knowledge base, and Memory simultaneously, the default metrics dashboard aggregates all traces across the entire project.
Solution: Go to Agent Operations → Metrics, select the Observations view, and enable Memory only (
memoryOnly) to inspect matching observation metrics. This option does not filter Scores; use the trace page filters for trace troubleshooting. See Metrics Monitoring and Analysis Reports.