
Traces, Observation Nodes, Sessions, and Manual Annotation
Feature Overview
Tracing and manual annotation (Traces, Observations, Sessions, Users, Scores & Annotation Queues) are the core daily troubleshooting and manual review workbench of Agentbase Agent Ops (Observability / AgentOps). In the development and production operations of agent applications, development teams not only need to view the end-to-end execution waterfall of a single request, but also need to search across traces for specific LLM calls (GENERATION) or tool executions (TOOL), reconstruct multi-turn conversation context by session (Session) or user (User), and continuously accumulate high-quality evaluation criteria through structured scoring (Scores) and collaborative multi-person annotation queues (Annotation Queues).
The following tracing and quality-review scenarios use the example project 企业智能客服与知识中台 (enterprise-ai-hub-210) and example organization Agentbase 企业智能中台 (69c6d1aa00062e6bb60); use your own resources in practice:
Track in real time the support ticket processing chains submitted by VIP architects
user_zhangwei_001and engineersuser_lina_002(e.g.,TK-20261022-001), freely switching within the same details page between theATIF-v1.8normalized agent trajectory, the Observation Tree, and the Timeline waterfall;Troubleshoot across traces the latency and Token consumption of
qwen-plus,text-embedding-v3,qwen3.7-text-rerank, and knowledge basekb_enterprise_support(includinggraphragandwikienhanced retrieval sub-nodes);Use Annotation Queues to assign difficult ticket chains to domain experts, using the
5 分钟租约(Lease)mechanism to complete multi-dimensional score reviews ofNUMERIC,CATEGORICAL, andBOOLEAN.
Core Concepts and Architecture
A single agent execution is deconstructed by the observability engine into a four-dimensional correlated structure of "top-level Trace container + tree of Observation nodes + normalized ATIF trajectory + multi-source Scores".
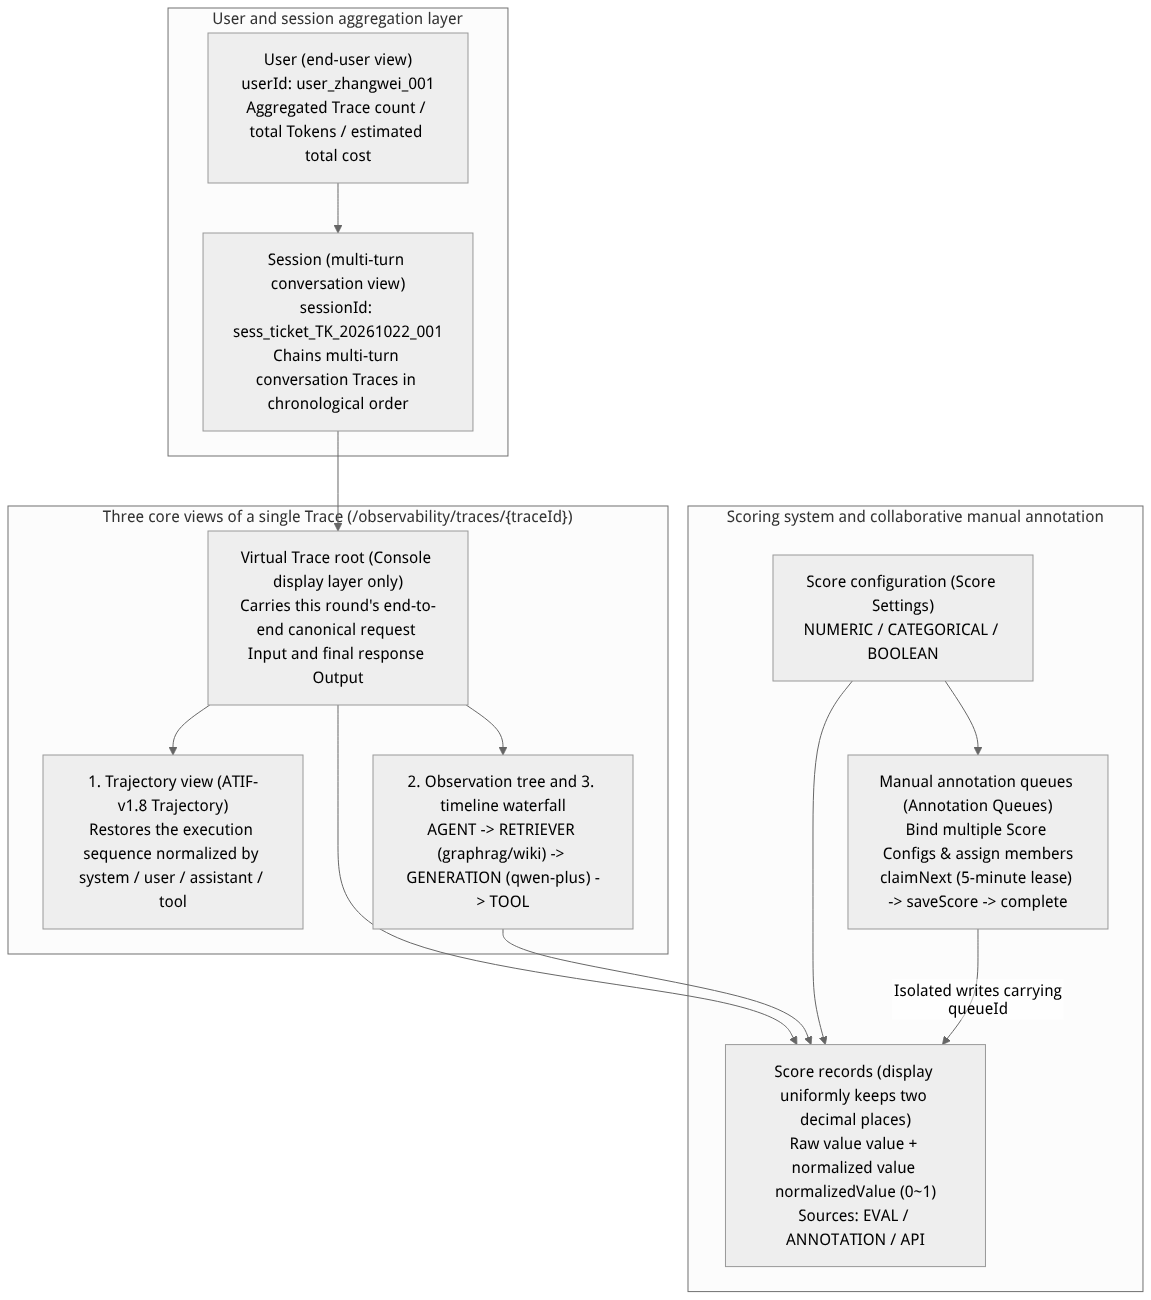
Flow diagram, not a runtime screenshot; read the relationships between steps or states along the arrows.
View the flow diagram in full size
Observation Node Types and Technical Semantics Table
Observation type (type) | Typical producing component | Core recorded fields and troubleshooting purposes |
|---|---|---|
AGENT | Agent Workbench (react.run / react.step) | Records the agent orchestration loop, thinking steps, and sub-task dispatch, correcting and maintaining the assistant / user / tool message role hierarchy. |
GENERATION | LLM Gateway / Memory / Agent Runtime | Can record model, modelParameters, input, output, usage, and estimated cost for model calls; some fields depend on what was reported. Do not treat missing provider usage as zero; cached can be a subset of input. |
TOOL | Agent tool execution (tool.execute) | Records the input parameters, return results, execution status, and latency of MCP tool, database query, or custom function calls. |
RETRIEVER | Knowledge base /search and Memory retrieval | Records the vector and hybrid retrieval process. In a knowledge base retrieval Trace, when enhanced retrieval is actually attempted, graphrag and wiki sub-nodes are also generated, recording retrieval.status, retrieval.returned_count, and stage.duration_ms. |
EMBEDDING | Embedding stage (embed_query) | Records the latency and Token consumption of calling text-embedding-v3 to generate query or document vectors. |
SPAN | Generic processing stage (context.prepare / HTTP / queue) | Records the latency of non-model internal stages (e.g., context preparation, the default skipped stage when enhanced retrieval is not requested, HTTP client calls, and queue delivery). |
EVENT | Instantaneous key event (memory.ingest.stage_failed) | Records instantaneous state transitions or abnormal events with no duration (e.g., stage error codes errorCode, gatewayStatus). |
EVALUATOR / GUARDRAIL / CHAIN | Example observation types | Availability depends on collected data; a type does not establish that content safety protection is enabled. |
Roles, Entry Points, and Relationships
Console entry points and REST API mapping
In the Agent Ops (Observability / AgentOps) sidebar of project enterprise-ai-hub-210, the correspondence between the related pages and the underlying APIs is as follows:
| Page name | Console path suffix | Core REST API endpoint | Required permission Scope |
|---|---|---|---|
| Trace list and details (Traces) | /observability/traces · /traces/{traceId} | GET /v1/observability/traces, GET /v1/observability/traces/{traceId} | observability.traces.read |
| Observations list (Observations) | /observability/observations | GET /v1/observability/observations | observability.traces.read |
| Session View (Sessions) | /observability/sessions · /sessions/{sessionId} | GET /v1/observability/sessions, GET /v1/observability/sessions/{sessionId} | observability.sessions.read |
| User View (Users) | /observability/users · /users/{userId} | GET /v1/observability/users, GET /v1/observability/users/{userId} | observability.users.read |
| Scores and Score Settings (Scores) | /observability/scores · /score-settings | GET/POST /v1/observability/scores, GET/POST /v1/observability/score-configs | observability.scores.read / write |
| Annotation Queue (Annotations) | /observability/annotations | /v1/observability/annotation-queues and /assignments, /items, /items/next, /scores, /complete | observability.annotations.read / write / submit |
Scope label filtering (APPBASE_TRACE_TAGS) and cross-system navigation
To help operations staff quickly distinguish Traces generated by platform managed capabilities from Traces reported by external business systems, the top of the Traces list provides scope filters based on authoritative telemetry labels:
capability:agent(managed agent traces): traces from the Agent Runtime workbench;capability:rag(managed knowledge base traces): document ingestion from the knowledge basekb_enterprise_support, GraphRAG/RAPTOR/Wiki builds, and hybrid retrieval traces;capability:memory(managed memory pipeline): write, retrieval, profile, and distillation pipelines from the Memory service (clicking the Trace tab on the Memory page automatically carries?tag=capability%3Amemoryand jumps here);agentbase-external(externally reported traces): traces reported autonomously by business applications via SDK or OTLP.
Feature Details and Operation Guide
1. Querying Traces and profiling the three detail views
Go to the Agent Ops → Traces page of project
enterprise-ai-hub-210.You can filter precisely by scope label, user ID (
userId, e.g.user_zhangwei_001), trace name (name), start and end time, or enter a complete Trace ID in the search box (in the Cloudnav deployment environment, you can also directly enterSOFA-TraceIdto search for matchingmetadata.cloudAtlasTraceId).Click any Trace to enter its detail page. The top of the page provides three view switch buttons: Trajectory, Observation Tree, and Timeline:
Default view and intelligent fallback rules:
When the server has generated a valid, non-empty persisted
ATIF-v1.8trajectory and the URL does not specify a particularobservationparameter, the page opens the Trajectory view by default, displaying multimodal content (including text, image, and audio structured fields) and tool call processes as normalizedsystem/user/assistant/toolnodes;When the URL carries a valid
?observation=<observationId>parameter, the page automatically opens the Observation Tree and highlights the selected node, making it easy for team members to share precise locations by copying the URL;If the current Trace is a pure retrieval trace or the ATIF trajectory has not been generated or is empty, the page safely falls back to the Observation Tree and disables the Trajectory button, never showing a blank panel.
Virtual Trace root explanation: The outermost layer of the Observation Tree and Timeline displays a virtual Trace root node, used to show the end-to-end normalized request (Input) and final answer (Output) of this round. This virtual root exists only in the frontend display layer and is not double-counted in the total Observation count, Token consumption, or slowest node statistics.
2. Filtering call observations across traces (GET /v1/observability/observations)
When you need to directly investigate "all ERROR-level TOOL calls in the past 24 hours" or "the longest-running qwen-plus GENERATION nodes", use the Observations list page or call GET /v1/observability/observations:
| Query parameter | Type | Required | Value constraints and pagination contract |
|---|---|---|---|
name | string | No | Exact match on observation node name (e.g. "qwen-plus-diagnosis"). |
type | string | No | One or more valid observation types, comma-separated, e.g. "GENERATION,TOOL" (empty items or unknown types are forbidden, otherwise 400 is returned). |
level | string | No | Log level filter: DEFAULT, DEBUG, WARNING, ERROR. |
traceId / environment | string | No | Exact filter by owning traceId or runtime environment (e.g. "production"). |
from / to | string | No | ISO-8601 start and end time range (if from > to, 400 is returned). |
limit | integer | No | Page size, value 1 ~ 100, default 25. |
offset | integer | No | Pagination offset, must be an integer multiple of limit (e.g. when limit=25, offset only allows 0, 25, 50..., otherwise 400 general_argument_invalid is returned). |
(
  set +x
  set -o pipefail
  : "${APPBASE_API_KEY:?Set APPBASE_API_KEY}"
  # Query all GENERATION and TOOL type observability nodes in project enterprise-ai-hub-210 (page 1, 25 items per page)
  builtin printf 'X-Appwrite-Key: %s\n' "${APPBASE_API_KEY:?Set APPBASE_API_KEY}" | curl --disable --header @- -fsS --get "${APPBASE_ENDPOINT:?Set endpoint including /v1}/observability/observations" \
    -H "X-Appwrite-Project: ${APPBASE_PROJECT_ID:?Set project ID}" \
    --data-urlencode "type=GENERATION,TOOL" \
    --data-urlencode "environment=production" \
    --data-urlencode "limit=25" \
    --data-urlencode "offset=0" | jq .
)
3. Tracking multi-turn Sessions and end Users
Session View (Sessions): Go to Agent Ops → Sessions and view all multi-turn Q&A Traces of the same customer during a single support ticket process grouped by
sessionId(e.g.sess_ticket_TK_20261022_001), making it easy to evaluate multi-turn intent following and contextual coherence.User View (Users): Go to Agent Ops → Users to view active time windows, cumulative Trace counts, Observation counts, total Token consumption, and estimated total cost aggregated by
userId(e.g.user_zhangwei_001,user_lina_002); click a username to drill down into all historical Traces initiated by that user.
4. Managing the scoring system (Scores) and the five-tier normalized distribution
Agentbase supports score configuration (Score Settings) for three data types:
Score data type (dataType) | Values and configuration method | Normalized value (normalizedValue) calculation rules and Console display |
|---|---|---|
NUMERIC (numeric) | Define a minimum minValue and maximum maxValue (e.g. 0 ~ 1 or 1 ~ 5) | The system strictly linearly normalizes raw scores to the [0, 1] range according to the configId bound to that Score (including archived configurations), and divides them into a five-tier quality distribution (Excellent / Good / Average / Poor / Very Poor). All numeric scores in the Console are uniformly kept to two decimal places (e.g. 0.92). |
CATEGORICAL (categorical) | Define an enumerated set of categories (e.g. ["准确", "部分遗漏", "严重幻觉"]) | Records the matched category string stringValue, supporting facet-based statistics of each category's share in the score list. |
BOOLEAN (boolean) | Binary judgment (true / false, corresponding to numeric values 1 / 0) | Suitable for binary compliance checks such as "whether the SOP was followed" or "whether a safety red line was triggered". |
Viewing and filtering scores: On the Agent Ops → Scores page, you can filter by multiple selections of time, evaluation task, five-tier quality tier, evaluator, source (
EVAL/ANNOTATION/API), and data type; expanding the top insights area shows total data volume, the normalized five-tier count distribution, and time trends.Direct manual scoring and batch deletion: Logged-in project members can directly add, modify, or delete
ANNOTATIONmanual scores on the Trace, Observation, or Session detail pages; the score list page also supports selecting up to 100 itemsANNOTATIONof manual scores on the current page, and executing asynchronous batch deletion after an irreversible confirmation (scores generated byEVALandAPIcannot be removed via manual batch deletion).
5. Using Annotation Queues for collaborative review
When you need to organize multiple domain experts to perform standardized blind reviews or re-checks of a batch of low-scoring or problematic online Traces/Observations/Sessions, use Agent Ops → Annotations:
Create an annotation queue and bind configurations and members:
Click Create Annotation Queue (
POST /v1/observability/annotation-queues), fill in the queue name (e.g."VIP工单回答质量专家复核队列"), and bind one or more score configurations (scoreConfigIds);Use member assignment settings (
PUT /v1/observability/annotation-queues/{queueId}/assignments) to assign project members allowed to participate in the queue's annotation.
Add items pending review to the queue:
Select target items in the Trace list, Trace detail, or Session page, and click Add to Annotation Queue (
POST /v1/observability/annotation-queues/{queueId}/items); idempotent enqueueing is supported, and you can view all queues an item belongs to along with theirPENDING/COMPLETEDstatus.
5-minute lease claiming, scoring, and completion closed loop:
Only assigned project members can click Start Annotation / Claim Next Item (
POST .../items/next) on the queue detail page;The system issues the member an 5-minute exclusive lease to prevent conflicts from multiple people annotating the same record simultaneously (if exiting midway,
POST .../items/{itemId}/releasecan be called to release the lease);The annotator refers to the original Trace/Observation/Session text on the left and enters scores and comments item by item according to all bound score configurations on the right (
POST .../items/{itemId}/scores; queue scores carry an exclusivequeueIdisolation mark and cannot be tampered with via ordinary direct scoring APIs);After completing all required score items, click Complete This Item (
POST .../items/{itemId}/complete); the queue item's status changes toCOMPLETEDand the queue completion progress advances automatically.
(
  set +x
  set -e -o pipefail
  : "${APPBASE_API_KEY:?Set APPBASE_API_KEY}"
  : "${APPBASE_ENDPOINT:?Set APPBASE_ENDPOINT to the target API endpoint including /v1}"
  APPBASE_ENDPOINT="${APPBASE_ENDPOINT%/}"
  : "${APPBASE_PROJECT_ID:?Set APPBASE_PROJECT_ID for the target environment}"
  # Example: create a human annotation queue via the REST API and add a difficult support ticket Trace to the queue

  # 1. Create a human annotation queue (bind numeric and boolean score configs)
  QUEUE_RESP="$(builtin printf 'X-Appwrite-Key: %s\n' "${APPBASE_API_KEY:?Set APPBASE_API_KEY}" | curl --disable --header @- -fsS -X POST "${APPBASE_ENDPOINT}/observability/annotation-queues" \
    -H "X-Appwrite-Project: ${APPBASE_PROJECT_ID}" \
    -H "Content-Type: application/json" \
    --data '{
      "name": "企业客服SOP合规与技术准确性复核队列",
      "description": "针对 P0 工单链路进行人工专家复核",
      "scoreConfigIds": ["sc_sop_compliance_bool", "sc_tech_accuracy_num"]
    }')"

  QUEUE_ID="$(echo "${QUEUE_RESP}" | jq -er '.id')"

  # 2. Idempotently add the ticket Trace to the annotation queue
  builtin printf 'X-Appwrite-Key: %s\n' "${APPBASE_API_KEY:?Set APPBASE_API_KEY}" | curl --disable --header @- -fsS -X POST "${APPBASE_ENDPOINT}/observability/annotation-queues/${QUEUE_ID}/items" \
    -H "X-Appwrite-Project: ${APPBASE_PROJECT_ID}" \
    -H "Content-Type: application/json" \
    --data '{
      "items": [
        {
          "objectId": "tr_support_ticket_20261022_001",
          "objectType": "TRACE"
        }
      ]
    }' | jq .
)
Finding a Trace
Select a time range and trace scope, and enter a trace name or ID; click Apply. Scope options include Agent, RAG, Memory, external traces, Agent Runtime, and Knowledge Base; PowerContext appears only when the instance provides that capability.
In the results, verify the name, time, latency, Observation count, Environment, User ID, and Session ID. Above the list, the total number of results is also displayed, along with the current page's P50/P95 latency, average Observation count, and number of Environments; these per-page statistics change as you paginate.
Click a trace in the list, or enter the current project's Trace ID in Open trace to open the details directly. If the opened list carries filter labels such as Name or User, you can click the × next to a label to remove that condition and continue browsing.
Name/ID search, category, and time range jointly affect the results. If no records are found, first widen the time range, restore the trace scope, and clear the search conditions; if there are still no results, then verify whether the Trace ID belongs to the current project, and whether the write side has sent Traces to that project.
Analyzing Trace Details
The top of the detail page shows the trace status, Error Observation count, Session, total duration, slowest Observation, and Token usage. If some generation records lack Token usage, the page labels the aggregate as "known usage"; do not interpret incomplete statistics as a complete total. When an associated Session ID exists, you can jump from the details to the corresponding session.
In the trace workspace, view the Observation tree, timeline, or the displayable Agent trajectory depending on the data. After selecting an Observation, the details panel on the right lets you inspect input, output, metadata, and associated scores; Observations may also include usage and cost information. The timeline is suited to locating phases with long durations or Error levels, while the tree view makes it easy to inspect the call structure along parent-child Observations.
The detail status is a signal generated from observed evidence: it shows Error when an ERROR-level Observation exists; Success when no such Observation exists but an Observation or latency evidence does; and Unknown when these evidences are missing. This status does not replace the application's own business response validation; Unknown or an empty Observation cannot be used to conclude that a call succeeded or failed.
The Traces entry on the Memory page opens the trace list filtered to Memory traces, which can be used to inspect the memory pipeline. To compare call volume, latency, tokens, or scores over a time range, continue to Metrics analysis; for dataset run records, see Datasets.
Trajectory normalization and reporting verification
Core concepts and data relationships
When integrating an external Agent or investigating an execution in the Console, distinguish these four concepts and their data boundaries:
Trace: the end-to-end boundary of one Agent or application execution. It records the current request's input, final output, and attribution such as the project environment
environment, useruserId, and releaserelease.Observation: a specific phase within a Trace. Common types include model calls (
GENERATION), tool execution (TOOL), Agent orchestration (AGENT), vector and hybrid retrieval (RETRIEVER), embedding (EMBEDDING), and general processing (SPAN). Parent-child references organize Observations into a call tree.Session: associates separate Traces through a shared
sessionId, allowing users to follow multiple conversation turns or a longer support workflow over time.Canonical trajectory (ATIF v1.8): Agent Trajectory Interchange Format v1.8. The platform extracts, validates, and persists this standard interaction sequence from stored Trace and Observation evidence.
Ingestion and derived data: external applications report raw Trace and Observation data through public Events ingestion or OTLP/HTTP Traces. The platform asynchronously derives and persists ATIF v1.8. These ingestion endpoints accept their documented reporting formats; they do not provide a contract for uploading ATIF directly.
Observation trees and conversation trajectories: an Observation Tree represents the technical call structure, while a Trajectory presents the interactions and decisions between system, user, assistant, and tool. Ordinary HTTP requests, context preparation (SPAN), queue operations, and retrieval-only (RETRIEVER) nodes support execution. Their captured data remains available in the tree and timeline; they do not necessarily produce conversation steps.
External Agent integration and reporting requirements
Use these five steps to report an external Agent and verify that its trajectory can be displayed and evaluated:
Configure separate project credentials for writing and reading All calls use public project authentication. A production exporter needs a project API Key with
observability.ingest.write. Automated readback uses a separate Key withobservability.traces.read, or users can inspect the Console. Keep the write Key separate from the verification read Key; production exporters do not need additional read permissions.Plan event identities and parent-child relationships Each event has two identities: the outer
event.idis the event idempotency ID, whilebody.ididentifies the Trace or Observation entity. Retry the same event with its originalevent.id. A new update event, such asgeneration-update, uses a newevent.idand retains the entity'sbody.id. Do not regenerate IDs for each retry. Use non-zero, 32-character lowercase hexadecimal Trace IDs and non-zero, 16-character lowercase hexadecimal Observation IDs when possible, so W3Ctraceparentcan carry the correlation across services. This format is recommended for component correlation and Trace Logs; Events ingestion itself does not require every entity ID to be hexadecimal. Every Observation'sbody.traceIdreferences the root Trace, andparentObservationIdreferences its direct parent Observation.Report model messages and tool relationships accurately
Roles and actual turns: a model Observation (
GENERATION) can reportinputas amessagesarray containingroleandcontent. Preserve the actualsystem,user,assistant, andtoolroles and turns. Record only that model call's realassistantresponse and tool requests (tool_calls) inoutput; never copy the input Prompt intooutputas if the model generated it.Context overlap across calls: when an execution makes multiple model calls, each
GENERATIONrecords the complete context actually supplied to that call. The platform identifies new turns using prefix-overlap rules. Do not remove real turns simply because their text is identical.Consistent tool call IDs: keep the model's
output.tool_callscallid, theTOOLObservation'smetadata.toolCallId, and the subsequent modelinputmessage'stool_call_idfor roletoolconsistent. The tool Observation supplies the call identity and real result; subsequent model messages preserve the result the model consumed. Parent-child Observation references do not replace tool call IDs. Some compatibility fallbacks exist, but new integrations should not rely on tool-name matching.Per-call usage: report each model call's
usageon its ownGENERATION. Avoid counting a parentAGENTaggregate together with its childGENERATIONusage. Leave unknown Token usage and Cost absent; do not invent zero values.General and source-specific handling: OpenCode traces have additional requirements for a unique, acyclic authoritative Context Snapshot, identity verification, and completeness. Ordinary external Agents should use general ChatML messages. Do not forge source labels or internal signatures to select a special parsing path.
Bound batches and inspect responses Events batches contain 1–100 events. Complete acceptance returns HTTP
200; partial failure returns207 Multi-Status. Always inspect individual entries inerrors[]. OTLP supports HTTP JSON or protobuf, optionally gzip, without gRPC. Its JSON body usesresourceSpans → scopeSpans → spans, without an Eventsbatchwrapper. The current OTLP endpoint returns the platform's converted event result: inspecterrors[]rather than assuming the standard OTLPpartialSuccessresponse.Verify the Console display and evaluation results After persistence, use Observability overview, Online and dataset evaluations, and Datasets for evaluation and benchmarking. For complete request contracts, field descriptions, and code examples, select Observability in the documentation site's SDK Reference or API Reference section.
Four reporting verification layers
HTTP 200, a Trace appearing in the list, or nodes in the Observation tree cannot independently prove that normalization and evaluation have completed. Verify each layer:
| Layer | Goal | Verification and criteria | Common causes of missing evidence |
|---|---|---|---|
| 1. Request accepted | The ingestion endpoint accepted every event | For Events, require HTTP 200, an empty errors[], and successes[] covering every original event ID. Treat 207 as partial failure. For OTLP, inspect the converted result and errors[]. Missing fields, non-JSON responses, or unacknowledged events do not prove full acceptance. | Missing authentication headers, too many events, invalid field types, or ignored per-event errors in a 207 response. |
| 2. Entities persisted | The asynchronous Worker stored the Trace and Observations | Inspect the tree and timeline in Trace details, or use the read Key to check the response's top-level trace and observations. | Data still queued, new entity IDs incorrectly generated during retries, or incorrect traceId / parentObservationId relationships. |
| 3. ATIF trajectory ready | The platform derived a valid, non-empty, ready trajectory in ATIF v1.8 | Open Trace details and inspect the available Trajectory view. For readback, check trajectory.schema_version=ATIF-v1.8, non-empty steps, and the expected steps. A non-empty field is only a necessary check; displayability does not prove that every evaluator has sufficient evidence. | A retrieval-only or ordinary HTTP trace has no model interaction, reporting is incomplete, roles are missing, or tool call IDs cannot be linked. |
| 4. Evaluation evidence sufficient | Evidence required by the selected Prompt, Agent, or Program evaluator is available | Inspect the Score and execution status in previews and results, including the selected template's scoring source and evidence notes. Exempt / Evidence limited indicates insufficient evidence for that metric; it is neither a normal pass nor a low score. Do not assume all templates use one status field. | Missing or duplicate model calls, Usage that cannot be assigned to a user turn, missing cache or command evidence, or trajectories exceeding the reading budget. |
Reporting and normalization FAQ
1. Why does an externally reported Trace contain GENERATION nodes but still have no usable trajectory?
Checks: stored Observations can appear in the tree before the platform derives a valid, non-empty,
readytrajectory inATIF v1.8. If a Trace containsGENERATIONbut its trajectory remains unavailable, check whether reporting is still incomplete, required model/tool evidence has arrived, andGENERATIONinput/outputcontains usable message roles (system/user/assistant/tool). For OpenCode, check whether the latest authoritative context is incomplete or fails identity verification. Retrieval-only and ordinary HTTP traces without model interaction need not generate a conversation trajectory.
2. Why are tool results missing or reported as conflicting?
Checks: call IDs link model
tool_calls,TOOLresults, and subsequenttoolmessages. Each modeloutput.tool_callsentry needs a non-emptyidand function name. Verify thatTOOLmetadata.toolCallIdmatches thatidand that the laterGENERATIONinput'stoolmessage carries the sametool_call_id. Tool Observation IDs must resolve to known model tool calls; conflicting or ambiguous results block projection. A later model's tool message alone does not replace complete execution evidence from a separate tool Observation.
3. What happens when message roles are wrong, a Prompt is copied into output, or identical turns are removed?
Checks: losing the actual
system,user,assistant, ortoolroles, or copying input intoGENERATIONoutput, can misclassify steps and make instructions look like model answers. Removing real turns with identical text breaks the context used for prefix-overlap comparison and may split history or repeat user steps. Report each call's actual complete context and its own output.
4. Why are Token statistics unreliable or labeled Exempt / Evidence limited?
Checks: the platform assigns canonical
GENERATIONusage to user turns. Missing, duplicate, or unassigned Generations, or missing usage needed by a metric, can limit Token rules. Canonical usage excludes parent Agent aggregates and evaluator usage. Do not represent an aggregate as another model call for display purposes; other consumers that aggregate data should also avoid parent-child double counting. Record known usage separately on each real model call.
5. How should HTTP 207 partial failures or network timeouts be retried?
Checks: for
207 Multi-Status, events insuccesses[]have been accepted. Inspect failed entries inerrors[]. Correct field or permission4xxerrors before resending. For network timeouts,429, or recoverable5xx, use bounded exponential backoff and reuse the original outerevent.idso retries retain their event identity.
FAQ and Troubleshooting
1. Why is the "Trajectory" button grayed out and unclickable, directly showing the "observation tree", when opening a Trace detail?
Cause analysis: The
轨迹view is dedicated to displaying theATIF-v1.8canonical trajectory generated by the agent runtime and fully persisted. If the Trace is a pure knowledge base retrieval (/search), a single Memory write, or the agent run is still reporting in batches and the required Generation/Tool evidence is not yet complete, the server has not yet generated an ATIF trajectory inreadystatus, so the frontend automatically displays the observation tree and disables the trajectory button according to the safe fallback rule.Resolution: For an Agent Run that is still running or has just finished, simply refresh the page after a few seconds. For non-Agent orchestration calls such as plain retrievals or gateway calls, view the details of each node directly in the observation tree and timeline.
2. Why does the GET /v1/observability/observations paginated query return 400 general_argument_invalid?
Cause analysis: The Observations list API adopts a strict page-aligned stable pagination contract:
limitmust fall between1 ~ 100, andoffsetmust be an integer multiple oflimit(for example, whenlimit=20, passing10foroffsetis rejected); in addition, a trailing extra comma in thetypeparameter (e.g.,"GENERATION,"), an unknown observation type, or afromtime later than thetotime will also return 400.Resolution: Compute
offset = pageIndex * limitfrom the page numberpageIndex(starting from 0), and ensure thetypeparameter contains only valid uppercase observation type enums.
3. Why can't a project admin or regular member click "Claim next item" or submit scores in Annotation Queues?
Cause analysis: Annotation queues enforce a strict assigned-member check: even with project view permission, if the currently logged-in user has not been explicitly added to the queue's assignment list (Assignments), the server rejects their lease claim (
claimNext) and queue score submissions. In addition, if an item is currently held by another assigned member and the 5-minute lease has not expired, other members cannot claim that item again.Resolution: Have the queue administrator add the target member to the assignment list in the queue settings. If a previous annotator temporarily leaves, you can click to release the lease, or wait for the 5-minute lease to expire automatically and then claim the item again.