
Limits and Quotas
Agentbase provides standardized usage aggregation views (Usage Aggregates) spanning the three levels of Account → Organization → Project, request rate limits (Ratelimit), resource quotas (Quota), large-model inference budget control, and platform-level independent read-only fences for project databases/file storage (Read-Only Governance). This chapter explains in detail the statistical methodology of each metering metric, how to interpret data completeness status, the read/write behavior boundaries during read-only governance, and troubleshooting methods for limit overruns.
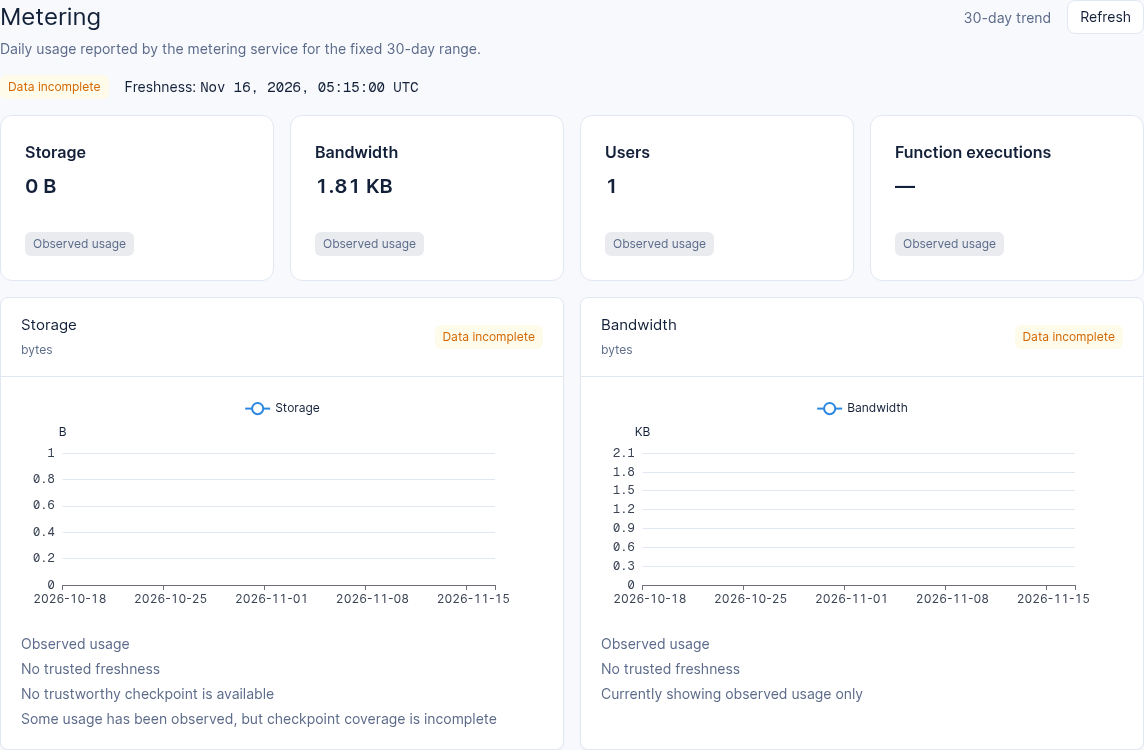
Interface reference: part of the metering page in a test project. Check your own page for data completeness.
Feature Overview
When multiple teams share a project, architects, operations leads, and finance specialists (the Billing role) need to precisely understand resource consumption levels and security protection boundaries:
Consistent three-level 30-day UTC usage accounting: identical aggregated views are provided at the account, organization, and project levels, covering the most recent 30 UTC days (including the current UTC day and the previous 29 days), spanning the four core metrics of Storage, Bandwidth, Users, and Function executions, with data coverage completeness clearly indicated (distinguishing
0from "data missing").Multi-dimensional quotas and rate limits: prevent a single misbehaving client or infinite-loop script from exhausting the cluster connection pool, storage space, or the LLM token budget.
AI-specific usage and sampling cost control: covering the monthly token budget of LLM Gateway keys, unified AI Gateway project-level traffic metering, content moderation 30 daily per-item call statistics, as well as the cost control of the default stratified sampling (30 records per capability by default) used for 2.10.0 knowledge index quality evaluation.
Platform-level independent project read-only governance (new in 2.10.0): during fault isolation, underlying migration, or compliance suspension, platform administrators can independently set a project's database domain (
databaseReadOnly) and file storage domain (storageReadOnly) to read-only, ensuring uninterrupted online read services while strictly preventing new dirty data writes, and retaining an emergency cleanup channel for a single record/single file.
| Governance and metering dimension | Statistics or control granularity | Console view entry | Deterministic system behavior when exceeded or triggered |
|---|---|---|---|
| 30-day core usage aggregation | Account-level / organization-level / project-level (aggregated by UTC day) | Account Usage · Organization Usage · Project sidebar Metering (/usage/aggregates) | Read-only observation dashboard; when metering sources are delayed or checkpoints are missing, it is explicitly marked as “Incomplete”, never fabricated as 0 |
| Platform quota and rate limit | Account-level / project-level / IP and session-level | /console/account/quota-limits · /console/account/rate-limits | When quota or concurrency rate thresholds are exceeded, HTTP 429 Too Many Requests or the corresponding quota-exceeded error code is returned |
| LLM inference budget and throttling | LLM Gateway key-level | Project 模型 (/llm-gateway) | Inference requests are rejected when a key's monthly token budget or RPM/TPM ceiling is triggered, protecting the upstream <DASHSCOPE_API_KEY> account balance |
| Project database/storage independent read-only | Project-level dual independent switches (databaseReadOnly / storageReadOnly) | Platform governance domain (Admin Panel); reflected on the project side as write-intercept responses | Routine writes to the corresponding domain are rejected (returning project_database_read_only / project_storage_read_only), with an exception allowing immediate deletion of a single record/single file |
Core Concepts and Architecture
Agentbase's metering, rate limiting, and read-only protection system runs through both the data-plane request entry and the background asynchronous metering pipeline. The sections below describe three-level usage aggregation and the scope of project read-only protection.
1. Definitions of the four core metering metrics over the last 30 UTC days
On the Metering / Usage page for accounts, organizations, and projects (as shown in Figure 1), the system always uses the current UTC day backward over a total of 30 UTC calendar days as the time window, uniformly displaying the following four core metrics:
| Metric name | English identifier | Measurement scope and coverage | Linked deep monitoring page |
|---|---|---|---|
| Storage space | Storage | The total storage bytes occupied by files in project buckets, build artifacts, and related persisted assets, plus the day-over-day change trend | Project Storage → Usage (/storage/usage) |
| Network bandwidth | Bandwidth | The sum of inbound and outbound network traffic through project endpoints within the statistics period | Project Overview bandwidth trend chart |
| End-user count | Users | The scale of registered end users under the project's Auth module and the daily growth trend | Project Auth → Usage (/auth/usage) |
| Function execution count | Function executions | The cumulative number of executions triggered by all cloud functions (Functions) within the project during the statistics period | Project Functions → Usage (including ACS container group CPU/memory/network/disk monitoring) |
2. Data completeness and anti-misleading design
In traditional monitoring reports, when the background collection pipeline is delayed or a time slice is missing, the missing day's value is often drawn directly as 0, easily misleading operations and finance staff into believing business came to a halt that day. Agentbase strictly distinguishes “actual usage is 0” from “metering data missing/incomplete”:
Complete: all metering sources, checkpoints, and sub-range data within the 30 UTC days are fully aligned.
Incomplete: when metering data for one or more days has not yet arrived or has gaps, those days are directly marked as Missing and never rendered as
0; meanwhile, the top of the page explicitly lists the specific reasons causing the incomplete coverage (for example:计量源不可用,检查点缺失,子范围缺失, etc.).Organization-level filtering rule: when an organization's
Ownersubmits an inactive project for deletion in Project cleanup, as long as the project is in a deleted state (Pending deletion/Purging), the organization-level Usage view automatically filters it out and it is not counted in the organization's aggregated usage.Concurrent anti-cross-page protection: when a user quickly switches between different organizations or projects in the Console, the frontend state machine provides request-generation isolation protection, so asynchronous aggregation results returned late from an old scope can never overwrite the page view of the newly selected project.
Project read-only status (platform governance)
This capability requires that the instance has project read-only protection enabled. If the deployment does not have it enabled, platform administrators also cannot directly toggle the read-only status; first confirm the instance capability, then follow the process below, and do not treat a capability-disabled response as a completed state transition.
A project can be set by platform administrators to database read-only or file storage read-only (two independent switches, since 2.10.0), for maintenance, migration, or fault isolation. Database read-only covers database, table, vector, knowledge base, and SQL writes; file storage read-only covers bucket and file writes. Enabling one switch does not automatically enable the other, nor does it lock all configuration of the entire project.
Impact on routine operations
The table below assumes existing identity and resource permissions are still satisfied; the read-only status does not add read or delete permissions.
| Operation | Behavior when the corresponding domain is read-only |
|---|---|
| Querying existing databases, tables, documents, and rows; reading, previewing, or downloading existing files | Usually can continue; if reading requires initializing missing structures, 403 or 503 may be returned |
| Creating or modifying databases, tables, columns, indexes, documents, or rows | Rejected when the database is read-only |
| Modifying knowledge bases, document metadata, chunks, or index configuration | Rejected when the database is read-only |
SQL writes and structural changes, including SQL DELETE | Rejected when the database is read-only; read-only queries on existing data are still subject to the original query permissions |
| Creating or modifying buckets, or uploading/modifying files | Rejected when file storage is read-only |
| Immediately deleting a single document, single row, or single file | The cleanup channel is retained; the original delete permission is still required |
| Bulk deletion, deleting an entire database/table/bucket | Rejected according to the owning domain; cannot be treated as a single-item cleanup exception |
Deletions staged via transactions are also not exempted as immediate deletions; the write restriction is still checked upon commit. Database read-only does not equal file storage read-only: for example, with only database read-only enabled, whether file uploads are allowed cannot be inferred from it — the storage status and original permissions must also be checked.
What to do when errors occur
First record the project, operation, time, and error type. The database domain typically returns
403 project_database_read_onlyand the storage domain returns403 project_storage_read_only; the GraphQL outer layer may still be HTTP 200, so check theerrorsin the response. SQL connections may also return a database access denial, so locating the issue requires combining the platform status.Confirm which domain the operation belongs to and whether it is truly a single-item immediate deletion; do not switch to bulk operations, SQL, or other call methods to try to bypass the read-only restriction.
Contact the platform administrator to confirm the current status and recovery plan. Ordinary project members or project API keys cannot lift the platform read-only status on their own; do not expand business key permissions for this purpose.
When a switch operation encounters 503, do not immediately repeat the switch or batch-replay writes. It may be a drain timeout before the switch commit, a state already committed but draining not finished, or an uncertain commit result. The platform administrator should verify the outcome through the authoritative status and switch records; cached values in ordinary project details alone cannot prove the switch is complete.
After writes are restored, first query the actual result of previous requests, then redo unsuccessful operations according to business idempotency rules, to avoid duplicate writes or accidental deletions.
Roles, Entry Points, and Relationships
1. Console entries for usage, quotas, and dedicated metering at each level
| Viewing target | Owning level | Console navigation location | Exact route path | Minimum required role |
|---|---|---|---|---|
| Account 30-day aggregated usage | Account level | Top Account → Usage / Metering | /console/account/usage · /console/account/metering | The account owner |
| Account rate limits and quota ceilings | Account level | Top Account → Rate limits / Quota limits | /console/account/rate-limits · /console/account/quota-limits | The account owner (read-only view) |
| Organization 30-day aggregated usage | Organization level | Organization tab Usage / Metering | /console/organization-{organization}/usage | Any organization member (including billing / analyst) |
| Project 30-day aggregated usage | Project level | Project left sidebar Metering | /console/project-{region}-{project}/usage/aggregates | Any project member |
| Cloud function ACS container group resource levels | Project level (functions) | Project Functions → target function → Usage | /console/project-{region}-{project}/functions/function-{function}/usage | Any project member |
| Model gateway key token usage and limits | Project level (AI) | Project Models → Keys / Usage | /console/project-{region}-{project}/llm-gateway/keys/{key}/usage | Any project member |
| Content moderation 30-day per-item call statistics | Project level (moderation) | Project Moderation (content moderation) home page | /console/project-{region}-{project}/moderation | Any project member |
2. AI dedicated metering and cost control overview
Beyond the four basic BaaS metrics, usage and cost control for AI and agent modules is distributed across their respective domain workbenches:
Model usage and observability:
In Models (
/llm-gateway), each issued Gateway key can be individually configured with a monthly token budget (Monthly Token Budget), request rate limits (RPM / TPM), and an allowlist of models it may call (e.g., onlyqwen-plusandtext-embedding-v3).In Agent operations (
/observability/metrics), inspect usage from the data actually collected; available dimensions and costs depend on the source.
Sampling quota control for knowledge index quality evaluation (2.10.0):
When creating a “knowledge index quality” evaluation task (targeting GraphRAG, RAPTOR, and LLM Wiki index artifacts) in Agent operations → Evaluation (
/observability/evals), the system enables stratified sampling by default, sampling30records per index capability by default for LLM Judge scoring and independent model review.Before creation, users can view the estimated number of evaluation items via the preview (
index-preview), or manually increase the sampling count or disable sampling to run a full evaluation (note: full evaluation has no hard cap on item count; the evaluation model Token cost and execution time consumed will grow linearly with the number of knowledge base index artifact records).
Content moderation (Moderation) dual-credential itemized metering:
At the top of the Moderation homepage, the total moderation call volume for the last 30 days is always displayed, broken down into two details: calls using platform-level credentials and calls using project custom credentials, making it easy to reconcile Alibaba Cloud Green content security bills.
Feature Details and Operation Guide
1. View and interpret the project's aggregated usage view for the last 30 UTC days
Log in to the Console and enter the project
企业智能客服与知识中台(enterprise-ai-hub-210).Click Metering at the bottom of the left navigation sidebar (route
/console/project-default-enterprise-ai-hub-210/usage/aggregates, as shown in Figure 1).Step One: First verify the data coverage status (Coverage Status):
Check the page status bar: if data coverage shows Complete, the aggregated values for the past 30 UTC days can be used directly as the basis for capacity planning and reconciliation.
If it shows Incomplete, carefully read the reason label given by the system (e.g., a checkpoint for a certain day has not yet been persisted); in this case, never misinterpret dates marked as "missing" as zero business traffic.
Step Two: Review the four core metering cards and the daily trend chart:
Check the current period cumulative values and daily bar/line trends of the four summary cards: Storage, Bandwidth, Users, and Function executions.
Step Three: Drill down to view function container-level compute consumption:
If a spike is found in
Function executions, click Functions in the left sidebar → enter a specific function → click the Usage tab to further view the cloud sandbox (ACS) container group's CPU usage, memory watermark, network I/O, and disk usage trends.
2. Verify account-level Quota Limits and Rate Limits
When online APIs occasionally encounter rate limiting (HTTP 429) or resource creation prompts that the plan limit has been reached, you can verify the quota baseline applicable to the current account and organization through the following steps:
Click Account on the right side of the top navigation bar of the Console to enter
/console/account.Switch to the Quota limits tab: view the hard upper limits on each type of resource allowed by the plan associated with the current account (such as the free organization count limit, the per-project platform registration count limit, the per-deployment function source package size limit, and the independent Java 17 JAR package size limit of 100 MB, etc.).
Switch to the Rate limits tab: view the per-minute/per-second concurrent request thresholds for each API route group (e.g., authentication login, database reads/writes, file upload, function invocation).
Development environment exemption tip: If a frontend engineer's high-frequency local page refresh debugging triggers a Ratelimit, go to the project's Overview → Integrations → Dev keys to create a short-lived Dev Key; carrying
X-Appwrite-Dev-Keyin debugging requests safely bypasses rate limits in the development environment.
3. Emergency handling and data cleanup operations in project read-only state
If your project has been placed in databaseReadOnly or storageReadOnly by a platform administrator due to platform migration or storage overage, follow these procedures when performing operations on the data management pages:
Identify read-only interception errors:
When you try to click Add row on the Console database table page, select multiple rows and click Delete (batch delete), or execute
DELETE FROM customer_tickets WHERE ...on the SQL page, the system will clearly report errorproject_database_read_only.When you try to upload a new file or delete an entire Bucket on the Storage page, the system will report error
project_storage_read_only.
Use the single-item immediate delete channel to free up space:
If read-only protection was triggered by disk or row count overage, and you need to delete some large historical files or redundant data rows to lower the watermark, do not use list multi-select batch delete.
Open the single file detail page or perform an immediate delete operation on a single row record (immediate deletion of a single document / single row / single file is an emergency cleanup exemption channel reserved by the platform and remains allowed during read-only periods).
Request lifting read-only: After completing space cleanup or confirming migration is done, contact the platform administrator to turn off the project's read-only switch in the admin backend; write capability is restored immediately.
FAQ and Troubleshooting
Q1: Why is test data created or functions executed in the early morning local time attributed to "yesterday's" or "today's" bar chart on the Metering page?
Cause and troubleshooting steps: Agentbase uses UTC calendar days as the aggregation boundary for all three Usage / Metering levels. The view always shows the current UTC day and the preceding 29 UTC days; it does not shift with the browser’s local time zone (for example, UTC+8). Usage generated at Beijing time 00:00 ~ 07:59 still belongs to the preceding UTC calendar day. Usage generated after 08:00 in the morning counts toward the new UTC calendar day.
Q2: I selected 10 records in the Console database table or storage bucket list and clicked batch delete; why did I get error project_database_read_only / project_storage_read_only, but deleting 1 individually succeeds?
Cause and troubleshooting steps: This is because the project is currently in a database read-only or storage read-only state enabled by a platform administrator. Under the read-only protection policy, to prevent accidental batch deletion or large-scale data destruction, all batch deletions, SQL DELETE statements, and whole-table/whole-database/whole-bucket deletions are strictly intercepted as write operations; only immediate deletion of a single document, single row, or single file is permitted as a compliant cleanup exception. To perform batch deletion, first confirm the selected data range and contact the platform administrator to lift the project's read-only state.
Q3: Why does a large model inference call fail even though the project's platform Quota and Ratelimit are not exceeded?
Cause and troubleshooting steps: Large model inference requests are constrained by both platform generic gateway rate limiting and model gateway (LLM Gateway) dedicated quotas. If the platform Ratelimit is normal but inference errors occur, check in the following order:
Go to the project's Models (
/llm-gateway) → Keys, and check whether the Gateway Key used by the current call has exhausted its Monthly Token Budget, whether a Key-level RPM/TPM rate limit has been triggered, or whether the target model of the request (e.g.,qwen-vl-max) is not in the Key's model whitelist.Go to Models → Providers and check whether the upstream provider's (e.g.,
dashscope-prod)<DASHSCOPE_API_KEY>has arrears on the Alibaba Cloud Model Studio side or has triggered a cloud provider-side concurrency quota limit.